


Abstract
High time resolution observations of PSR B0906−49 (or PSR J0908−4913) over a wide range of frequencies have enabled us to determine the geometry and beam shape of the pulsar. We have used the position angle traverse to determine highly constrained solutions to the rotating vector model which shows conclusively that PSR B0906−49 is an orthogonal rotator. The accuracy obtained in measuring the geometry is unprecedented. This may allow tests of high-energy emission models, should the pulsar be detected with Gamma-Ray Large Area Space Telescope. Although the impact parameter β appears to be frequency dependent, we have shown that this is due to the effect of interstellar scattering. As a result, this pulsar provides some of the strongest evidence yet that the position angle swing is indeed related to a geometrical origin, at least for non-recycled pulsars. We have shown that the beam structures of the main pulse and interpulse in PSR B0906−49 are remarkably similar. The emission comes from a height of ∼230 km, and is consistent with originating in a patchy cone located about halfway to the last open field lines. The rotation axis and direction of motion of the pulsar appear to be aligned.
1 INTRODUCTION
Pulsars are highly magnetized, rotating neutron stars which emit beams of radio emission at a low height above the star's magnetic poles. The emission is confined to the open field lines and the beam only sweeps out a small fraction of the celestial sphere. For this reason, we see emission from only one pole in the vast majority of pulsars. In fortunate geometrical circumstances, however, the second pole should also be observable as a radio emitting site if the spin axis is almost orthogonally orientated to the line of sight to the Earth. Such pulsars can be identified by the detection of an ‘interpulse’ (IP) separated by ∼180° in pulse longitude from the main pulse (MP). Less than 30 pulsars have been identified to show IPs (Ribeiro 2008; Weltevrede & Johnston 2008) from the known population of ∼1800 pulsars. Not all IPs arise from the second magnetic pole – some of them can also be interpreted within a geometry of an aligned rotator where the observer's line of sight never, or hardly, leaves the emission cone during the pulse period (e.g. Manchester & Lyne 1977).
The RVM has been used extensively to derive geometrical angles in a number of pulsars (Rankin 1983; Lyne & Manchester 1988). Unfortunately, there are many factors which mean that α and β are often subject to large uncertainties. These include a covariance between α and β which cannot be broken over the usually small longitude range over which pulsars emit (e.g. von Hoensbroech & Xilouris 1997; Everett & Weisberg 2001), but also orthogonal modes and propagation effects in the pulsar magnetosphere (Everett & Weisberg 2001). For these reasons, multifrequency studies of a given pulsar rarely give similar values for α and β as the uncertainties are large (e.g. Mitra & Li 2004).
Some information about the geometry can also be obtained from the evolution of pulse profiles with frequency. The observational data show that the low-frequency pulse profiles tend to be wider in extent than the high-frequency profiles (Thorsett 1991), and the explanation for this is that radio emission originates at different heights in diverging dipolar magnetic field lines. In this model, high-frequency radio emission originates from closer to the stellar surface than low-frequency emission with emission heights ranging from several tens to several hundreds of km (Mitra & Rankin 2002). Recent evidence tends to suggest that, at a given frequency, the emission height varies across the polar cap with lower emission heights over the magnetic axis (Gupta & Gangadhara 2003). Also observations indicate that low-frequency profiles are often dominated by strong-central components whereas high-frequency profiles show strong-outrider components in many cases. This has been interpreted as indicating a different spectral index for core and cone emission (Rankin 1983), while geometrical factors may be at least partly responsible (Kramer et al. 1994).
When considering emission heights, it is intriguing to also consider the observational consequences of relativistic effects in the magnetosphere. Blaskiewicz, Cordes & Wasserman (1991) pointed out that, to first order, the main effect is that the PA swing is delayed with respect to the total intensity profile, and the magnitude of this effect is directly proportional to the emission height. This effect should therefore be frequency dependent if different frequencies originate at different heights. The studies by Blaskiewicz et al. (1991), von Hoensbroech & Xilouris (1997) and Mitra & Li (2004) showed evidence for this effect in a sample of pulsars.
In this paper, we present observations and their analysis of PSR B0906−49, a 106 ms pulsar discovered by D'Amico et al. (1988) which allow us, as it turns out, to study our described understanding of pulsar emission. Initial observations showed that the profile consisted of two widely separated components. Polarization observations at 0.66 and 1.6 GHz were carried out by Qiao et al. (1995) and Wu et al. (1993), respectively. They showed that the profile is virtually 100 per cent linearly polarized with an indication of a small fraction of circular polarization. The time resolution of the observations was low and each component was largely featureless. Wu et al. (1993) attempted an RVM fit to the PA swing and determined that α= 58° and β= 30°. This fit indicated that the emission arises from a single pole and supported the idea that young pulsars had wide profiles (Manchester 1996).
In a survey looking for pulsar wind nebulae, Gaensler et al. (1998) discovered an unusual looking nebula around PSR B0906−49. The head of the nebula is clearly resolved and a bow-shock indicates that the direction of motion of the pulsar is at an angle of ∼315° (measured as north through east). Polarization properties of the pulse profile can give an indication of the PA of pulsar's rotation axis, and we will investigate if the correlation between the velocity and rotation axis seen by Johnston et al. (2005) is also evident in this pulsar, and whether it confirms the direction of motion suggested by Gaensler et al. (1998).
The organization of the paper is as follows. In Section 2, we briefly discuss multifrequency observations of PSR B0906−49 as a part of a bigger campaign to measure the polarization in southern pulsars generally. In Section 3, we show how the profile of PSR B0906−49 evolves with frequency and present our RVM fits, and re-examine, in particular, the question of whether this pulsar shows emission from a single, wide pole or from two poles. We discuss the implications of the RVM fits in Section 4 and derive a model for the beam of PSR B0906−49.
2 OBSERVATIONS
All observations were carried out using the Parkes 64-m radio telescope located in central New South Wales, Australia. PSR B0906−49 was observed on a number of occasions at a range of frequencies over the period 2004 December to 2007 July. The observing bands were centred on the frequencies of 1.37, 3.10 and 8.6 GHz and the bandwidths used were 256, 1024 and 512 MHz, respectively. In all the cases, the back end used was the wide-band correlator specifically designed for high time resolution polarimetric observations of pulsars. At all the frequencies we sampled the data with 1024 phase bins across the pulse period. The correlator performs online folding and de-dispersion at the topocentric period and dispersion measure. Before each observation of the pulsar, a pulsed calibration signal was observed to allow correction of the gain and phase between the two-feed probes. At each frequency, observations were made of the flux calibrator Hydra A to provide accurate flux densities.
Data reduction was carried out using the psrchive software package (Hotan, van Straten & Manchester 2004). The final product was a fully polarimetric- and flux-calibrated pulse profile at each frequency. We are able to obtain absolute PAs for the linear polarization using techniques described in Johnston et al. (2005). From multifrequency observations made in 2005 July, the rotation measure of PSR B0906−49 was determined to be 13.0 ± 0.2 rad m−2 (cf. 10.0 ± 1.6 rad m−2 in Qiao et al. 1995).
3 RESULTS
3.1 Profile evolution
Fig. 1 shows the polarization profiles of PSR B0906−49 obtained at 1.4, 3.1 and 8.6 GHz. Zero-longitude coincides with the fiducial point derived from the beam considerations discussed in Sections 4.2 and 4.3. Values for φ0 quoted in Table 1 were measured relatively to this longitude.
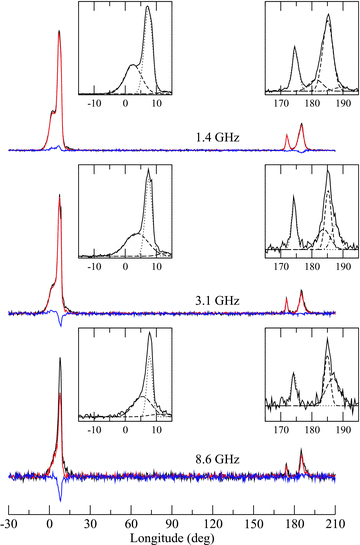
Polarization profiles of PSR B0906−49 obtained at three frequencies. While the IP shows hardly any frequency evolution, the MP exhibits an unusual behaviour (see the text). The circular polarization changes sign between the low and high frequencies. The insets show a Gaussian decomposition of the MP and IP.
Geometry determined from RVM fits at three frequencies. While the left-hand columns show results obtained by freely fitting for all angles and the resultant reduced χ2, the last column lists β obtained after keeping α fixed at an angle of 96°. Quoted uncertainties were estimated using Monte Carlo simulations.
| ν (GHz) | α (°) | β (°) | ζ (°) | φ0 (°) | χ2red | β* (°) |
| 1.4 | 96.60 ± 0.03 | −8.1 ± 0.1 | 88.5 ± 0.1 | 11.31 ± 0.05 | 0.98 | −8.47 ± 0.08 |
| 3.0 | 96.22 ± 0.07 | −6.4 ± 0.2 | 89.2 ± 0.2 | 11.35 ± 0.06 | 1.30 | −6.4 ± 0.2 |
| 8.4 | 96.1 ± 0.4 | −5.9 ± 0.6 | 90.2 ± 0.6 | 10.8 ± 0.3 | 0.82 | −6.0 ± 0.5 |
The higher time and frequency resolution of our data as compared to that of Wu et al. (1993) allows us to distinguish features in the profile not previously seen. The MP consists of a small leading component blended with a stronger, narrower trailing component. In contrast, the IP is a separated double profile with the trailing component somewhat stronger than the leading component. Johnston & Weisberg (2006) have pointed out that a double-pulse structure with the trailing component dominating appears typical of young pulsars generally and both the MP and IP show this behaviour. The MP–IP separation remains essentially constant at all frequencies and the intensity ratio of MP and IP remains unchanged, indicating similar radio spectra.
The IP hardly shows any frequency evolution, although the central part between the prominent components becomes notably weaker, leading to sharper inner edges of the components. This behaviour is typical for many pulsars (Lyne & Manchester 1988). In contrast, the MP undergoes clear changes with frequencies. The dominant component remains the strongest at all frequencies, while the outer components (in particular, the leading one) become weaker at higher frequencies.
3.2 Polarization and its evolution
Typical of young pulsars, the profile of PSR B0906−49 (both MP and IP) is virtually 100 per cent linearly polarized. Only at 8.4 GHz does the polarization appear to decrease with both MP and IP having a fractional polarization near 70 per cent.
At 1.4 GHz, the MP shows positive circular polarization in the first two components with a hint of negative circular in the trailing component. The value of |V| is 4.1 per cent. In the IP, there is no circular polarization in the leading component, but about 9 per cent of negative circular polarization in the trailing component. At 3.1 GHz, the polarization has changed sign in the dominant component of the MP – there is a little or no circular polarization at the leading component but about 9 per cent of negative circular polarization is found in the trailing component, the peak of which is offset from the total intensity peak. In the IP, the circular polarization remains negative in the trailing component with a value of about 7 per cent. At 8.6 GHz, the circular polarization has increased in the main component of the MP. There is now 15 per cent of the negative circular polarization and the peak of the circular is aligned with the total intensity peak. In the IP, the circular polarization is rather low with an upper limit of about 6 per cent but appears to be positive in sign. In other words, it seems that the MP and IP show a mirror symmetry in changing handedness of circular polarization. We note that in the low-frequency profiles of Qiao et al. (1995), there appears to be little circular polarization in the IP but significant positive circular in the MP.
The picture where circular polarization is stronger in the trailing component in young pulsars was pointed out by Johnston & Weisberg (2006) but this is one of the few pulsars in which the sign of V changes as a function of frequency. In the compilation of Han et al. (1998), only PSR B1240−64 shows unambiguous evidence for a sign change from low to high frequencies.
3.3 Rotating vector model fits
Fig. 2 shows the measured values of the PAs of the linear polarization, Ψ, and fits of the RVM to those. In contrast to the large majority of pulsars where the small duty cycle prevents a reliable determination of the RVM parameters (Everett & Weisberg 2001), the highly polarized IP of PSR B0906−49 allows a very precise measurement of the magnetic inclination angle α, the impact parameter β (or alternatively, the line-of-sight angle ζ=α+β) and the offset angles Ψ0 and φ0, determining the symmetry positions of the fitted curve in PA and longitude, respectively. Table 1 lists the results obtained for each frequency. We obtain excellent fits with a reduced χ2 of close to unity at all three frequencies, clearly indicating an orthogonal geometry. This is in contrast to the results of Wu et al. (1993), who obtained α= 58°. Inspecting their fig. 4, we note that our PA values for the IP are offset from theirs by 180° (an inherent ambiguity to measured PAs). Performing a fit to our PA values in such an arrangement is possible but results in much worse fits (χ2red > 200), so we believe that our solution is the correct one. Indeed, a free fit to all parameters results in consistent values at all frequencies, in particular, in α close to 96°. Given the problems often encountered in obtaining reliable RVM fits, this is an extraordinary result. The results are so precise that they reveal a surprising, unexpected decrease in the magnitude of the impact angle β with increasing frequency. We confirm this observation by keeping α fixed in subsequent fits (see Table 1) and a visual inspection of Fig. 2 which indeed shows a steepening of the PA curve at the inflexion point φ0. We see the same trend, albeit with much larger uncertainties, by fitting the MP and IP separately. Such fits can also be used to determine the φ0 independently for MP and IP. Doing this by keeping α fixed to 96° (see below) to increase the accuracy, we measure an MP–IP separation of  .
.
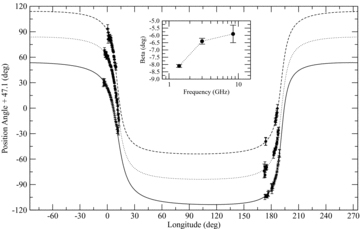
PA of the linearly polarized emission and RVM fits. The 1.4 GHz data and their fit (solid line) and the 8.4 GHz data and their fit (dashed line) are offset by −30 and +30°, respectively, to the 3.0 GHz data (dotted line) for clarity.
For reason discussed in detail in Section 4.1, we consider the solution obtained at the highest frequency as the correct intrinsic geometry. We therefore come to the conclusion that αMP= 96°, βMP=−6°, αIP= 84°, βIP= 6°. This implies that we are seeing the MP and IP at the same impact angle on opposite sides of the pole. This is unusual in itself, compare for example the situation in PSR B1702−19, where the impact angles for the MP and IP are quite different (Weltevrede, Wright & Stappers 2007). Finally, the inflexion point of the RVM occurs later than either the profile mid-point or the profile peaks.
3.4 Rotation axis and proper motion direction
As outlined in the introduction, Gaensler et al. (1998) detected a bow-shock nebula around PSR B0906−49, with the inference that the direction of motion was ∼315°. The RVM fits described above show that the rotation axis points towards 48° or 228°. There is therefore an offset of 87° between the proper motion direction and the rotation axis. We have shown elsewhere (Johnston et al. 2005, 2007) that the probable implication of this is that the proper motion vector and the rotation axis are likely to be aligned, with the pulsar emitting linear polarization in a mode with the plane of polarization orthogonal to the magnetic field direction. This is consistent with our earlier results obtained from the different samples of pulsars, and also confirms the interpretation of the bow-shock nebula by Gaensler et al. (1998).
4 DISCUSSION
4.1 Frequency-dependent geometry?
The geometrical interpretation of the RVM implies that the determined values for α and β should be independent of frequency. Therefore, our results of a changing β and φ0 reported in Fig. 2 and Table 1 is somewhat surprising. Usually, the geometry of a pulsar cannot be determined with such high precision as is possible here, so that this effect may not have been noted for other sources before. However, rather than questioning the geometrical interpretation of the RVM, other explanations may apply. Indeed, as we show in the following, the apparent change can be explained by an undetected scattering of the pulse profile at lower frequencies.
We investigated the impact of interstellar scattering on the observed PA swing in a similar fashion to that presented in the research note of Li & Han (2003). We confirm their results that large scattering leads to flat PA curves over the longitudes of the scattering tail. Such obvious effects of scattering are, however, not visible in the data for PSR B0906−49 presented here. Hence, we studied the impact of much smaller scattering times. For this we used a noise-free template constructed from the determined Gaussian decomposition of the observed profile. We assigned a constant degree of linear polarization and computed Stokes Q and U from the RVM fits to the 8.4 GHz data as shown in Table 1. We then convolved the Stokes I, Q and U with a scattering tail as caused by a thin screen in the interstellar medium located halfway between the pulsar and the observer (e.g. Williamson 1972). The resulting PA swing was computed from the scattered Stokes Q and U intensities and subjected to the same RVM fitting process as the real data. This process was repeated for scattering times in the range from 0 to 5 phase bins, yielding the results shown in Fig. 3.
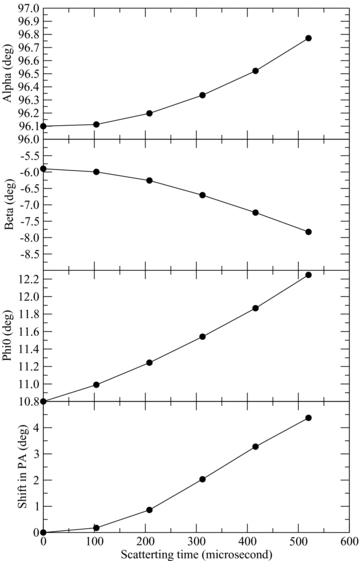
Results of simulations investigating the impact of weak interstellar scattering on the observed PA swing and the derived geometry. Systematic changes in the determined values are clearly visible. Values for zero-scattering correspond to those observed at 8.4 GHz.
The general agreement between the simulations and the observations is remarkable. While the predicted change in φ0 is somewhat too large, the behaviour of the measured α and β is well reproduced. This confirms that, based on the polarization profile observed at 8.4 GHz, the PA swings (and the derived values for α and β) at 3.0 and 1.4 GHz can be well explained by a scattering of the profile with scattering times of only about 200 and 500 μs, respectively. These scattering times are so small that the corresponding total power profiles are hardly distinguishable from the unscattered profile in our simulations. Future high-resolution, low-frequency studies should enable us to trace the frequency evolution of these scattering effects.
While the geometry derived from the RVM is therefore indeed independent of radio frequency, we note that the simulations also produce a shift in absolute PA that does depend on observing frequency. Even though this shift is only 4° over a frequency range from 1.4 to 8.4 GHz, we point out that this effect might affect rotation measures determined from RVM fits over widely separated frequencies. However, the precision to which the geometry can be determined for PSR B0906−49 is unrivalled, so that in practice this effect may be small compared to other sources of uncertainties.
4.2 Aberration effects
The precision obtained in fitting the RVM model to the observed data, promises to allow us to study aberration effects in pulsar radio emission. A first-order relativistic treatment of the RVM leads to the expectation that the inflexion point of the PA swing, φ0, should be delayed with respect to the profile mid-point by an amount ΔtPA= 4 ×rem/c, where rem is the emission height (Blaskiewicz, Cordes & Wasserman 1991; Hibschman & Arons 2001; Dyks, Rudak & Harding 2004; Dyks 2008).
The main difficulty in showing whether aberration is occurring or not is the determination of the location of the pulsar's fiducial point. For pulsars with symmetrical pulse profiles, one generally locates the fiducial point in the profile centre but for more complex pulse profiles, the situation is much less clear although one can also use the profile's frequency evolution as a help. In the case of PSR B0906−49, the MP is rather asymmetric (and becomes more so at higher frequencies). For the IP, the profile is much more symmetrical (and remains so at high frequencies) suggesting that the IP mid-point should be separated by 180° from the fiducial point of the MP. This is indeed how we chose the zero-degree reference point for the pulse longitude in Fig. 1, even though it is clearly not centred on the MP profile. We discuss this issue further in the next section.
4.3 Beam description
We can draw all the strands of the above arguments together to come up with a plausible beam model for PSR B0906−49 for the following reasons. We believe the best location for the fiducial point of the MP and IP is at 0° and 180° as shown in Fig. 1. First, this is the mid-point of the symmetrical IP profile. Secondly, there is a hint of a central component at this location in the IP at 1.4 GHz and this has a steeper spectral index than the outer components in accordance with the general rule for central components. This implies that the leading component in the MP is more centrally located (and also has a steeper spectral index), and we see emission at the trailing edge but not at the leading edge of the emission cone.
The offset between our purported profile fiducial point and the inflexion point as determined by the RVM is therefore ∼11°. This value can be used to determine an emission height of ∼230 km, and the emission from both the MP and IP must originate from approximately the same height. In turn, the emission height can be used to determine the half-opening angle of the open field line region, ρ, which then must be ∼18°. This is about a factor of 2 larger than the measured half-width of the profile which is about 9° for both the MP and IP (although we do not see the leading emission in the MP). Interestingly, the derived value of ρ for PSR B0906−49 is very close to that given by the relationship  with the pulse period P measured in seconds (e.g. Kramer et al. 1994), determined empirically from a large sample of pulsars.
In Fig. 4, we have drawn a sketch of a possible configuration of the beam for both the MP and IP. The emission appears to arise from a cone of thickness ∼3° which is located about halfway out to the last open field lines. The emission cone is not fully illuminated but rather consists of active patches. Both the MP and IP sight lines appear to cross two such patches. What is remarkable is that the active regions in the magnetosphere near both poles happen to lie on the same cone.
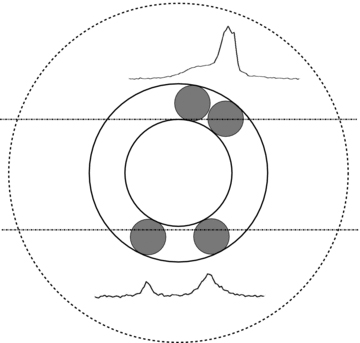
A possible configuration for the beam of PSR B0906−49. The active regions in the magnetosphere appear to fall into the same cone for both MP and IP and so we have shown only one cone here. The outer dotted circle represents the region bounded by the last open field lines. The active emission cone is shown by the solid circles; its location and width is dictated by the width of the pulse profiles. The line of sight for the MP traverse is the top solid line; it cuts two active patches near the centre and on the trailing edge of the cone. The line of sight for the IP traverse (bottom solid line) also cuts through two active patches but they are more symmetrically placed about the beam centre. The resultant pulse profiles (MP and IP) are also shown.
5 CONCLUSIONS
High time resolution observations over a range of frequencies for PSR B0906−49 have enabled us to determine the geometry and beam shape of the pulsar. Uniquely amongst pulsars, even amongst those with IPs, we have been able to determine highly constrained RVM fits which show conclusively that PSR B0906−49 is an orthogonal rotator. We have shown that the value of β appears to be frequency dependent; however, careful modelling shows that this appears to be entirely due to the effect of interstellar scattering of the profiles. While other factors usually dominate the uncertainties in the geometry derived from RVM fits, it should be considered, in particular, for low-frequency observations or observations of short-period pulsars. It will also be relevant for future high-sensitivity detections and studies of IP sources with the Square Kilometre Array (Cordes et al. 2004).
Interestingly, the relatively high ratio of spin-down luminosity  to distance d as measured by
  makes this pulsar potentially detectable with the Gamma-Ray Large Area Space Telescope. This would be an exciting opportunity to test competing gamma-ray emission models, given the very well determined geometry of this pulsar. For instance, outer gap models (e.g. Chiang & Romani 1994) predict that orthogonal rotators should be gamma-ray bright as we look directly into the null-charge surface, i.e. the bottom part of the outer gap (Yadigaroglu & Romani 1995).
We have shown that the total intensity structure of the MP and the IP in PSR B0906−49 have similarities. While the degree of linear polarization is very large in both MP and IP, the circular polarization changes handedness with increasing frequency with an intriguing mirror symmetry between the MP and IP. The emission comes from a height of ∼230 km in both and is consistent with an origin in a cone with a radius of only one half of the beam opening angle. The cone is patchy as we do not detect the leading emission from the MP.
In summary, this pulsar represents a showcase for many features of pulsar radio emission, combined in a single, remarkable source. But most of all, this source provides conclusive evidence for the geometrical interpretation of the PA swing within the RVM. Many pulsars, however, in particular recycled pulsars, show large deviations from a simple RVM swing in which cases the geometrical interpretation has to be questioned. In this case, however, the evidence is incontrovertible.
The Australia Telescope is funded by the Commonwealth of Australia for operation as a National Facility managed by the CSIRO. We thank Andrew Lyne and, the referee, Jarek Dyks for their useful and stimulating comments on the manuscript.
REFERENCES
