


Abstract
We examine Abell 1689 non-parametrically, combining strongly lensed Hubble Space Telescope images and weak distortions from wider field Subaru imaging. Our model incorporates member galaxies to improve the lens solution. By adding luminosity-scaled member galaxy deflections to our smooth grid, we can derive meaningful solutions with sufficient accuracy to permit the identification of our own strongly lensed images, so our model becomes self-consistent. We identify 11 new multiply lensed system candidates and clarify previously ambiguous cases, in the deepest optical and near-infrared data to date from Hubble and Subaru. Our improved spatial resolution brings up new features not seen when the weak and strong lensing effects are used separately, including clumps and filamentary dark matter around the main halo. Our treatment means we can obtain an objective mass ratio between the cluster and galaxy components. We find a typical mass-to-light ratios of M/LB = 21 ± 14 inside the r < 1 arcmin region. Our model independence means we can objectively evaluate the competitiveness of stacking cluster lenses for defining the geometric lensing–distance–redshift relation in a model-independent way.
1 INTRODUCTION
Hubble Space Telescope (HST) imaging of the galaxy cluster Abell 1689 (A1689) has revealed an exceptional number of strongly lensed multiply imaged galaxies, including high-redshift candidates. Previous studies have used these data to obtain the most detailed dark matter (DM) reconstructions of any galaxy cluster to date, based on parametric methods and resolving substructures ∼25 kpc across. A fuller exploration of non-parametric cluster lensing is increasingly motivated by new dedicated deep Hubble imaging surveys, with the aim of examining DM structures in the least biased way. Multiple sets of lensed images are now typically identified in deep, high-resolution images of any cosmologically distant cluster imaged with Hubble (with the exception of the CLASH cluster RXJ1532.8+3021; Merten et al. 2014), allowing systematic exploration of the cluster DM and discovery of the most distant galaxies (Broadhurst et al. 2005b; Clowe et al. 2006; Zitrin et al. 2009, 2010, 2011; Coe et al. 2010, 2012, 2013; Zheng et al. 2012). In practice, secure identification of multiple images need the guidance of a reasonably accurate lens model as even the counterimages of large arcs are typically hard to find given the complexities in the central mass distribution of clusters, so that images for a given source are far from symmetrically located.
Furthermore, due to the uncertain redshifts of faint lensed images, even when a reliable mass model can be built, counterimages are predicted to fall on long, largely radial loci or may fail to be generated at all if the unknown source distance is insufficient. This means that there are often several contending counterimages unless internal colours and morphology are sufficiently distinctive. Photometric redshifts, if unambiguous, are very helpful in selecting counterimages that are too faint for spectroscopy. The 16 overlapping broad-bands of the CLASH programme (Postman et al. 2012) covering from the UV to the near-infrared (NIR), maximizes the photometric redshift accuracy possible with Hubble and have provided reliable examples of the most distant galaxies known, as in the case of the z ≃ 11 candidate lensed by MACS0647 (Coe et al. 2013), where multiple images are identified both photometrically and geometrically.
To date, the galaxy cluster A1689 remains the best studied cosmic lens with hundreds of magnified images in the central region visible in deep Hubble images (Broadhurst et al. 2005b). Over a hundred of these arcs have been matched to their corresponding background galaxies by several authors and their redshifts estimated (Broadhurst et al. 2005b; Halkola, Seitz & Pannella 2006; Limousin et al. 2007; Coe et al. 2010), including several of the brightest highest redshift galaxies known, extending to z ≃ 7.6 (Frye, Broadhurst & Benítez 2002; Frye et al. 2007, 2012; Bradley et al. 2008). The relaxed appearance of this cluster and the relatively undisturbed optical and X-ray morphology have made A1689 a preferred target for constraining the equilibrium mass profile by several independent means (Lemze et al. 2008; Sereno et al. 2013).
Several studies have reconstructed the mass distribution using the strong lensing (SL) data alone (Broadhurst et al. 2005b; Diego et al. 2005b; Halkola et al. 2006; Jullo & Kneib 2009; Coe et al. 2010) and in combination with weak lensing (or WL hereafter) measurements (Broadhurst et al. 2005a; Limousin et al. 2007; Umetsu & Broadhurst 2008) including the use of background red galaxies whose surface density is depleted by lens magnification and independent observationally from WL shear. A1689 has been studied also using higher order derivatives of the lensing potential, like the flexion, (see Leonard, King & Goldberg 2011, for a recent analysis). The mass profile of A1689 was shown to be very well fitted by the standard Navarro, Frenk and White (NFW) profile describing the equilibrium mass distribution expected for collisionless, cold dark matter (CDM; Broadhurst et al. 2005a,b) but with a concentration that is surprisingly high. Triaxiality of the mass distribution has been explored as a mean to boost the projected concentrations, and certainly may be expected to be partially responsible (Oguri et al. 2005; Broadhurst & Barkana 2008; Sereno et al. 2013).
A1689 has been subsequently followed at other wavelengths, allowing lensing to be combined with SZ and X-ray data (Sereno et al. 2013) and also with the dynamics of member galaxy motions via the Jeans equation and via velocity caustics (Lemze et al. 2009). Multiwavelength science opens the door to new exciting studies since it is no longer sufficient to model the DM mass or gas separately but instead both have to be integrated in the same model in order to explain the observations. Previous work on A1689 combines HST and Chandra and reveals some tension between hydrostatic+lensing reconstruction and other observations (Zekser et al. 2006; Leonard et al. 2007; Lemze et al. 2008; Umetsu & Broadhurst 2008; Cain, Schechter & Bautz 2011; Sereno & Umetsu 2011). Peng et al. (2009) finds a discrepant hydrostatic mass based on X-ray data from Chandra but Riemer-Sørensen et al. (2009) find that excluding substructure alleviates or even eliminates the discrepancy. Lensing data combined with X-ray and SZ data have the potential to reveal information not only about the invisible DM distribution but also about the physical phenomena taking place in the cluster that have to bring the gas pressure and DM-driven gravity to a quasi-equilibrium state. The new Frontier Fields programme1 is now underway to provide the deepest Hubble data ever recorded for massive lensing clusters, further motivating our assumption-free modelling.
Despite exhausting lensing studies of A1689, many arcs still remain unmatched for this cluster. Certainly, many missing counterimages of highly magnified images are too faint to be useful or remain undetected. Others are of too low contrast to be detected within the light of luminous cluster members. Inaccuracy of mass models used to reconstruct the mass distribution is another issue, given the significant variation between published solutions. In Ponente & Diego (2011), the authors show how very erroneous mass distributions can still reproduce lensing data to high accuracy. In other words, being able to reproduce the observed arcs is no guarantee that the reconstructed mass distribution is right. The most detailed SL analysis of A1689 have been able to match tens of arcs, have relied either on the distribution of member galaxies to guide the models or on parametric models with the inclusion of many parameters depending on the number of substructures adopted.
However, the persistent resistance of some obvious bright lensed images to be matched with other images (when the same models predict other bright counterpart(s) for those lensed images) suggests that these models are still missing fundamental pieces needed to solve the puzzle. One of the limitations of SL data is that it quickly becomes insensitive to the mass distribution beyond the Einstein radius, especially if the distribution of matter around the centre is approximately spherical. Clumps with a significant amount of matter that lie just beyond the Einstein radius might go unnoticed with these parametric models as the model contains enough parameters within the Einstein radius to easily fit the data. Attempts have been made to constrain the matter distribution beyond the Einstein radius of A1689 by combining the WL data with SL data but in all cases (to the best of our knowledge) these joint analyses have been made a posteriori when either the density profiles are combined to extract a single density profile (Umetsu & Broadhurst 2008) or the SL solution is tested against the WL data for consistency (Limousin et al. 2007).
In this paper, we revisit A1689 to obtain a truly joint solution combining in a single inversion (i.e. not a posteriori) the SL and WL data. By doing this, our two-dimensional model of the mass distribution has to account simultaneously for the multiple lensed systems observed in A1689 and for the reduced shear measurements that extend well beyond the Einstein radius. As reference cosmological model, we consider a flat ΛCDM model with Ωm = 0.3.
2 ACS DATA
In this paper, we used public imaging data obtained from the ACS (filters: F450W and F814W) and the WFC3 (filter F125W), retrieved from the Mikulski Archive for Space Telescope. The data come from two different programmes. The F814W (ACS) and F125W (WFC3) data were obtained within the HST programme 11718 (PI Blakeslee, Cycle 17), from 2010 May 29 to July 8, while the ACS F475W images were obtained within the programme 9289 (PI Fors, Cycle 11) on 2002 June 16. The total exposure time is 9500, 75172 and 14367 s in the F450W, F814W and F125W filters, respectively. The F814W data set has been independently reduced and used by Alamo-Martínez et al. (2013) to study the intracluster population of globular clusters. The data reduction of the optical data consisted in two main steps, based mostly on multidrizzle (Koekemoer et al. 2002).2 First, we combined the images obtained in each run and optimized the image sampling. Then, we performed cosmic rays rejection and aligned the images.3 The final mosaic has a pixel scale 0.05 arcsec. We combined these three bands images to produce the colour image of the new candidate lenses shown in the appendix.
3 LENSING DATA ON A1689
A compilation of systems found in the literature is shown in Table A1 in the appendix. They are obtained basically from three sources: Broadhurst et al. (2005b), Limousin et al. (2007) and Coe et al. (2010). Many of these systems are also listed in Halkola et al. (2006). Table A1 is built after cross-correlating the original tables in the references above to avoid repetitions. Systems that were listed originally in Broadhurst et al. (2005b) are referred as B05. Systems that appear in both Limousin et al. (2007) and Coe et al. (2010) or just in Coe et al. (2010) are listed as C10. Systems that appear only in Limousin et al. (2007) are listed as L07 and the new system candidates presented in this paper are listed as D14 in Table A1. Some of the original systems in Broadhurst et al. (2005b) were rearranged or updated with additional arclets by other authors in later papers after comparison with alternative mass models. In this paper, we rely on the original selection of Broadhurst et al. (2005b) after excluding some dubious systems but we explore also the solutions obtained after incorporating the alternative systems published in the literature. The exclusion (or re-arrangement) of some systems listed in Table A1 is made after a new visual colour and morphology comparison of the system members based on the new and deep ACS images. For instance, the confusion between systems 10 and 12 can be resolved by the presence of a pinkish core in system 10 not present in system 12. Different authors (Limousin et al. 2007 and Coe et al. 2010) have suggested alternative rearrangements for some of these systems. Although we do not consider all the alternative possibilities in this paper, they might be perfectly valid as well. In fact, as we show later, some of the new counterimages discovered by other authors (like in system 12) will be naturally predicted/confirmed by our model, and hence, fully consistent with it. For systems listed in Broadhurst et al. (2005b), we maintain the original system identification. Alternative identifications of the central counterimages of some systems have been used in Limousin et al. (2007) and Coe et al. (2010). Some of these alternative identifications are also reflected in Table A1. Although not explicitly mentioned in the Table A1, the last system in Halkola et al. (2006) corresponds (at least partially) to our system 58 in Table A1. The last 11 systems of Table A1 (denoted with D14 in the REF column) should be treated just as mere candidates since they are obtained after identifying new system candidates using our solution discussed below and without a proper photometric redshift estimation. The new candidate systems are shown in Figs A1 and A2 in the appendix. The stamps are extracted from a red giant branch composite image of three Hubble filters (F475W, F814W and the NIR F125W). Some of the positions listed in Coe et al. (2010) were incorrectly reported in the tex file of the original paper. These positions have been corrected in Table A1. Table A1 contains a total of 50 systems.4 Systems 25 and 32 contain multiple candidates for some of the secondary images and will not be used in our analysis. Out of the 50 systems listed in Table A1, we use only a reliable subset of 26 systems corresponding to systems 1 through 30 in Broadhurst et al. (2005b) but excluding suspicious systems 20, 26, 27 (in addition to system 25 mentioned above) which show different colours between the different counterimages once the new IR data is included in the colour images. Stamps of these systems that we exclude from our analysis are shown online in the same web page.5
System 10 and 12 have been re-matched after examination of new IR data. The rematching is based on (1) the very distinctive colour of the nucleus (once the IR band is added) of the original 12.2, 12.3 images which is similar to the colour of the nucleus of the original system 10; (2) the need for the original system 12.2, 12.3 to have other counterimages in the field of view (according to the different models we have checked); (3) the predicted counterimages for the original system 12.2, 12.3 fall near the positions of system 10 and (4) the fact that both systems have the same spectroscopic redshift. All these facts make us believe the original system 10 and the images 12.2,12.3 are in fact the same system.
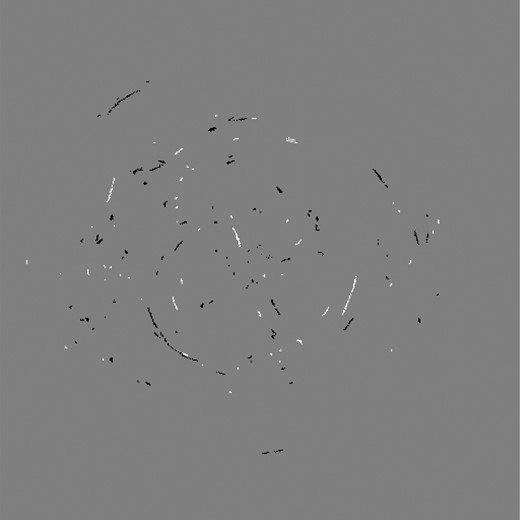
Our WL data are derived from Umetsu & Broadhurst (2008) based on Subaru Vi′ imaging observations. The background galaxies are selected requiring they are redder than the cluster sequence by (V − i′) > 1 and 20 < i′ < 25.5 resulting in a mean density of background galaxies of 12 arcmin−2 and a mean effective redshift of 0.68. We assume this mean redshift for all the background galaxies. We refer the reader to that paper for a detailed description of their observations and analysis. In this work, we use two-dimensional reduced-shear data on a regular grid of 10 × 10 independent grid points with 1′ spacing, covering the central 10 × 10 arcmin2 region out from the original 30 × 25 arcmin2 region. We are mainly interested in the central region but extending the lensing constraints a bit further beyond the regime of the SL data can help to stabilize the solution. Extending our analysis to distances much farther would have no effect on the constraints derived in the central region. We exclude from our analysis the innermost four pixels overlapping with the SL regime, so that our WL data set consists of 100 − 4 = 96 reduced-shear data points. Fig. 1 (left) shows the two data sets used in this paper as well as the distribution (and morphology) of member galaxies that will be used to build the fiducial deflection field (see the next section). The right-hand panel shows the central 3.3 × 3.3 arcmin2 region (WL data not shown).
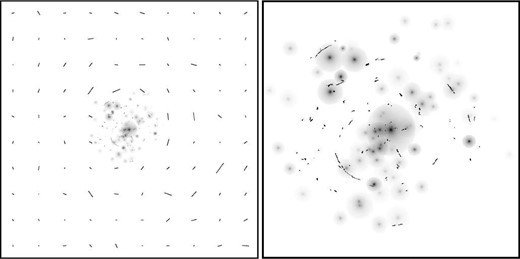
Data set used for the reconstruction. The left-hand panel shows the entire field of view of 10 arcmin with the SL, reduced shear measurements, the position of the fiducial galaxies and their assumed shapes. The right-hand panel shows a zoom into the central 3.33 arcmin region with the arcs and galaxies that shows better extent of the haloes in our model.
4 RECONSTRUCTION METHOD
We use the improved method, wslap+, to combine the weak and SL data and perform the mass reconstruction. The reader can find the details of the method in our previous papers (Diego et al. 2005a,b, 2007; Ponente & Diego 2011; Sendra et al. 2014). Here, we give a brief summary of the most essential elements.
Earlier work has shown how the addition of the small deflection fields from member galaxies can help improve the mass determination when enough constraints are available (see for instance Kassiola, Kovner & Fort 1992; Kneib et al. 1996). In our previous paper (Sendra et al. 2014), we quantified via simulations how the addition of deflections from all the main member galaxies helps improve the mass reconstruction with respect to our previous standard non-parametric method. Strongly lensed galaxies are often locally affected by member galaxies. However, these perturbations cannot be recovered in grid-based reconstructions because the lensing information is too sparse to resolve member galaxies. For our study, we select the 73 brightest elliptical galaxies in the cluster central region and associate with them a mass according to their luminosity. The member galaxies are selected from the red sequence. We assume the fiducial deflection field comprising these member galaxies just scales by a fixed luminosity–mass ratio. Later, the fitting procedure determines this proportionality constant that allows for the best reproduction of the data. For the mass profiles, we assume a NFW profile (Navarro, Frenk & White 1997), and adopt a self-similarity approach where the scale radius scales with the mass. As discussed later, the choice of the particular profile is not very relevant for our results. In Sendra et al. (2014), we used one deflection field to model all the galaxies in the cluster. In the case of A1689, we go a step further and we use two deflection fields (i.e Ng = 2, see definition of Ng above). The first one is associated with the central type-cD galaxy and the second one contains the deflection field from the remaining dominant galaxies in the cluster. Each deflection field contributes in our model as one free parameter (its amplitude with respect to the fiducial amplitude). In principle, one could incorporate an independent deflection field for each one of the member galaxies but caution has to be taken to maintain as much as possible the orthogonality between the grid cells and the individual deflection fields. This will be studied in Section 7. Settling for two deflection fields may be regarded as a fair compromise between the overly simple assumption that all galaxies in the cluster have individual haloes with masses that trace light following the same luminosity–mass relation and a potentially more realistic but also unnecessarily complex assumption that each galaxy has a different luminosity–mass ratio. We make an exception for the central cD galaxy because of its distinctive shallow luminosity profile and the separate origin that may be implied by the anomalously large numbers of globular clusters for this object and cD galaxies in general (see Alamo-Martínez et al. 2013). All the galaxies used in our fiducial model are shown in Fig. 1 where we use a non-linear colour scale to better show the extent and shapes of the individual haloes in our fiducial model. As in our previous paper (Sendra et al. 2014), we consider truncated NFW profiles to construct our fiducial model.
5 RESULTS
When combining the WL and SL data sets, due to the large field of view (10 × 10 arcmin2), and in order to maximize the resolution of the grid in the region covering the SL part of the data, we use a two resolution grid where the central 6.66 × 6.66 arcmin2 is sampled with smaller grid cells (of 9.37 arcsec in size) and the remaining area is sampled with 25 arcsec grid cells. Fig. 2 shows the grid configuration. The small gap that can be appreciated between the two regions has a negligible effect since this region gets filled by the overlapping Gaussians on top of each grid cell. The use of a multiresolution grid introduces a bias in the reconstruction (see discussion below) in the transition region between the two resolutions mostly due to the overlap of Gaussians with different widths. The outer region is used as a buffer zone that, however, still contributes to the WL constraints in the transition phase between the two regions. Hence, we do not make full use of the results from the outer region in our conclusions but instead we will restrict ourselves to the central 6.66 × 6.66 arcmin2 region for most of our results. However, we should note that even within the central region caution has to be taken when interpreting the results close to the transition phase as some biases are still present near the border.
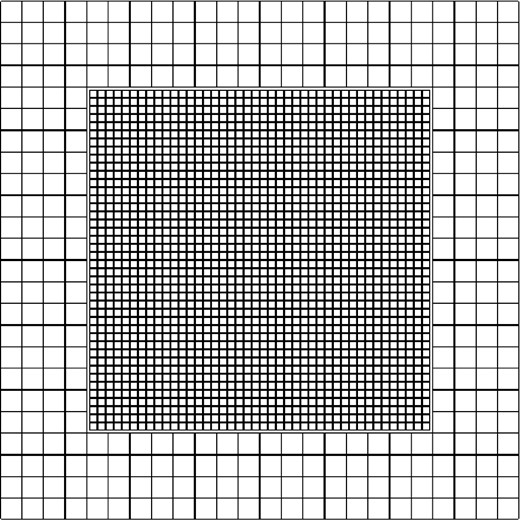
Grid used in the reconstruction. The grid cell sizes are 25 and 9.37 arcsec. The high-resolution grid covers an area of 6.66 × 6.66 arcmin2.
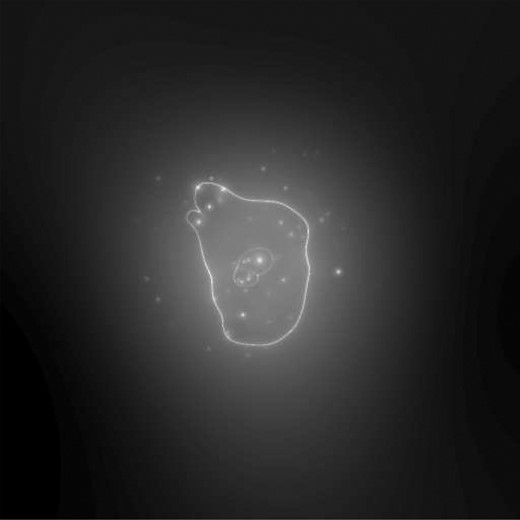
For comparison purposes, we have performed the reconstruction in three different cases depending on the data set used. In case (i) we use only the SL data set, in case (ii) we use only the WL data set and in case (iii) we combine the SL and WL data set into the same data vector. In order to make a direct comparison, we use the same grid for all three cases although this is not optimal for the SL or WL case. In the SL-only case, we would use only a regular grid covering a smaller field of view (of 3 × 3 arcmin2) while in the case of the WL-only case, we would also use a regular grid (with poorer resolution) but over the entire 10 × 10 arcmin2 field of view. Since our main interest is on the solution obtained when the SL and WL data sets are combined, we maintain the same grid configuration in all three cases. Also, we start the minimization in the same initial condition to eliminate this degree of freedom from the solution (different initial conditions are explored later in the paper). Finally, we use the same number of iterations (8000 iterations, this number will be discussed later) in the SL-only and SL+WL cases. For the WL-only case, we stop the minimization before to avoid overfitting (a large number of iterations in the WL-only case would produce a solution that is capable of reproducing the noisy WL estimates so the minimization must be stopped before this regime is reached). In Fig. 3, we present the 2D-reconstructed mass in the central region and the associated critical curves for a source at redshift 2 for the three cases. From left to right, we show the cases of the SL-only, WL-only and SL+WL. Note how the critical curve does not change much in the case SL+WL when compared with the SL-only case. This is a consequence of the critical curve being much more sensitive to the very central region (and the SL data). However, when the WL data is used in combination with the SL data, new interesting features in the mass distribution emerge even beyond the Einstein radius. Some of these features appear even more intriguing when looking at the magnification map (see Fig. 4) where some filamentary structures and clumps are made more evident. Both the projected mass and magnification maps are closely connected and the magnification map in this weaker lensing regime can be used as an alternative tracer of the mass especially in the range of interest shown in Fig. 4 where the convergence, κ < 0.5, and κ ∼ γ. In this regime, and to first order, the magnification, μ, can be approximated (by Taylor expansion) as μ ≈ 1 + 2κ that shows the clear connection between magnification and projected mass. Further investigation of these features demands better-quality WL data and will be the subject of future studies. The small critical curve around the clump at the edge of the bottom-right quadrant is close to a feature seen also in Umetsu & Broadhurst (2008). This fact suggests that the feature in our reconstruction, although it could be affected by its proximity to the buffer zone, may also be produced by a real structure in that area.
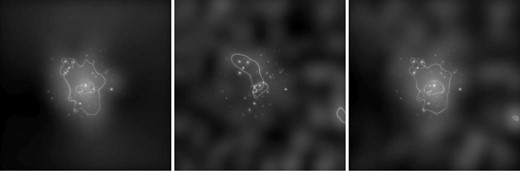
Solutions (and associated critical curves for a source at redshift z = 2) for the cases where only the SL data is used in the reconstruction (left), only the WL data is used in the reconstruction (centre) and both, the SL and WL data are used in the reconstruction (right). In all cases, only the central 6.66 × 6.66 arcmin2 region is shown.
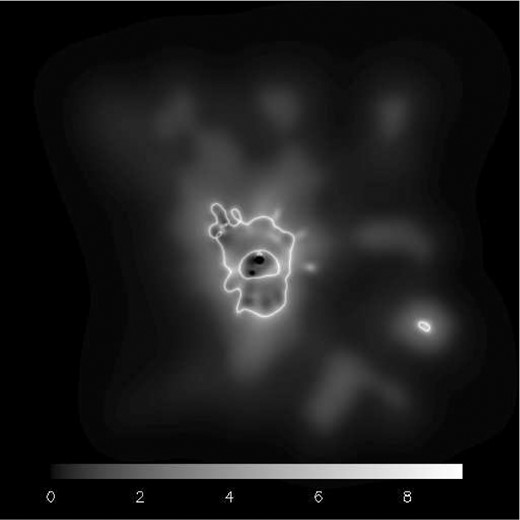
Magnification map in the entire field of view of 10 × 10 arcmin2 for the SL+WL case. The colours are in log-scale to increase contrast. The two small black regions in the centre correspond to magnifications less than 1 (that have been set to 0 in the log-scale for contrast purposes). The drop in the outer region (buffer zone) is a systematic effect due to the larger cell size in the grid. The features close to the transition region between the two grid resolutions are not always to be trusted.
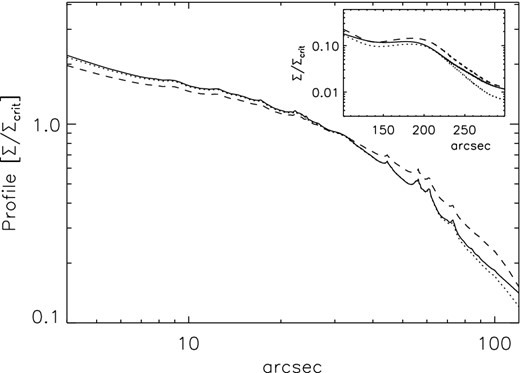
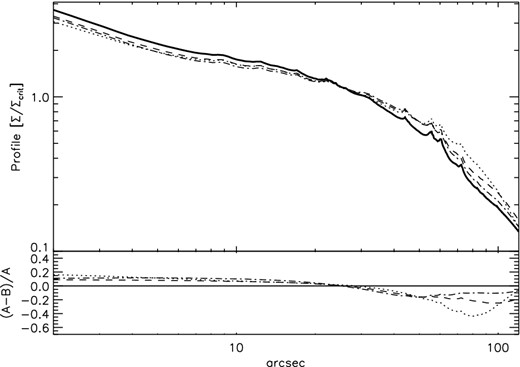
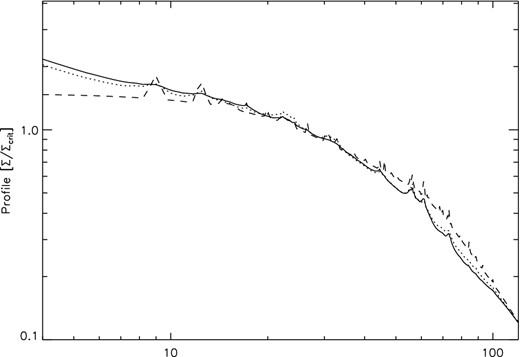
A more quantitative comparison of the different solutions is shown in Fig. 5 where we show the density profiles of the surface mass density in terms of critical density. Unless otherwise noted, the critical density, Σcrit = 4.746 × 10¹⁵ M⊙ h Mpc−2, is computed for zmean = 1.07. The WL-only case shows the typical mass-sheet degeneracy which has not been corrected in our solution. Also, in the WL-only solution, the mass at the centre is mostly associated with the individual galaxies accounting for the reduced shear in the vicinity of the Einstein radius, while the grid complements the central galaxy mass. This is better seen when comparing the values of C1 (coefficient for the galaxies in the cluster except the type-cD) and C2 (coefficient for the type-cD galaxy) for each case: for the SL-only case, we get C1 = 0.30, C2 = 0.25; for the WL-only case, we get C1 = 0.55, C2 = 0.28 and for the SL+WL case, we get C1 = 0.33, C2 = 0.26. The WL-only case has more freedom to increase the mass in the galaxies since this does not affect the SL constraints.
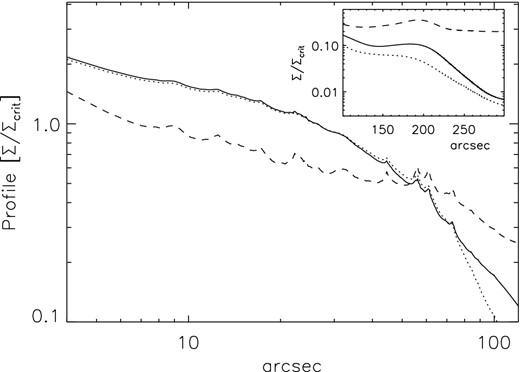
Profiles of the solutions obtained with SL data only (dotted), WL data only (dashed) and the combination SL+WL (solid). The smaller plot shows the same profiles but in linear scale and beyond 100 arcsec. The units in the axis are the same as the larger plot. The systematic bump at 200 arcsec (or 3.33 arcmin) coincides with the position of the transition phase (for the grid) between the 6.66 arcmin region and the outer buffer zone
On the other hand, in the SL-only case, the grid plays a more central role and accounts for most of the mass. Also, the SL-only case shows a sharp drop in mass beyond the Einstein radius, which is expected for this grid-based model, due to the lack of sensitivity of the SL data to the outer regions. When the SL and WL data sets are combined in the joint reconstruction, the new joint profile shows a smoother behaviour to larger radius and the solution compares well with previous estimates of the profile derived from SL-only and WL-only. Both grid and galaxies play important roles in fitting the SL+WL data set.
In terms of source reconstruction, Fig. 6 shows the reconstructed sources for the two cases, SL-only (left) and SL+WL (right). In the two panels, the centre and the scale are the same. In both cases, the solutions obtained with SL-only and SL+WL data seem to be able to form 1–3 arcsec sources that fall near well-defined caustics.
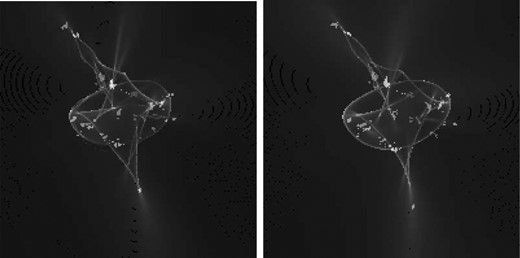
Caustics (at z = 2) for the SL only (left) and SL+WL case (right) compared with the reconstructed sources. Each source is represented with a different colour index from 1 (darkest grey) to 26 (lightest grey). The field of view is small and corresponds to 1.3′ across to maximize the focal plane. The centre is the same in both cases and corresponds to the centre of the original 10′ field of view.
In Fig. 7, we show the ratio between the 2D-reconstructed mass map and the corresponding profile. A circularly symmetric mass distribution should behave as a constant sheet of value Ratio = 1. Deviations from this value highlight the asymmetries in different regions of the cluster. Note how the central region exhibits a more symmetric structure but around the Einstein radius there are important deviations from the mean profile by a factor ≈4 above and below the mean density. The largest deviations occur near the buffer zone, and may be affected by the proximity to this transition phase. Overall, a left–right global asymmetry (or gradient) is appreciated across the field of view. A similar asymmetry can also be found in Umetsu & Broadhurst (2008). The rings around the centre are due to the individual galaxies which produce spikes in the profile.
Asymmetric behaviour of the mass density in the central region of 6.66 × 6.66 arcmin2. The plot shows the ratio between the solution 2D map (SL+WL case) and the corresponding circularly symmetric profile, that is, each pixel at a distance r from the centre is divided by the profile at the same r. In order to increase contrast, the ratio is saturated beyond the value 7.5 and we show the square root of this ratio.
5.1 Comparison with previous results and analytical models
It is important to compare the results obtained with our non-parametric algorithm with those obtained using fully parametric methods but a similar data set. Fig. 8 shows our solution compared with two analytical models that fit solutions obtained by parametric methods. Broadhurst et al. (2005a) found that the NFW profile did not fit well the SL+WL data in a similar way similar to our results, with a tendency to be too steep in the centre (r < 50 kpc).
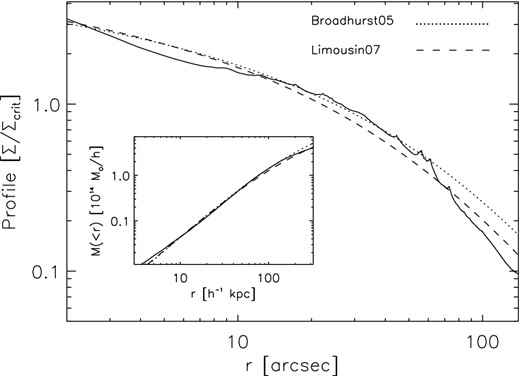
In Fig. 9, we compare the radial mass profile derived from our solution with previously published results of A1689 based on different lensing techniques. In the SL regime, our solution overlaps well with the SL modelling results of Broadhurst et al. (2005b). Our results are also in good agreement with the model-independent mass profile of Umetsu et al. (2011) derived from combined WL shear-and-magnification measurements based on the Subaru data. When compared with previous work, we find a good agreement between our solution and other solutions, in terms of the profile and the location and shape of the radial critical curve, although the tangential critical curve we obtain extends further to the south than previous SL solutions.
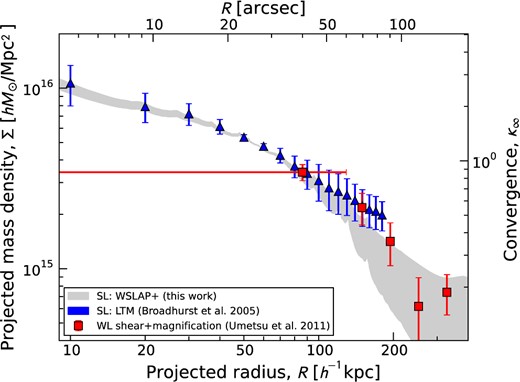
Comparison of the profiles from our solution (grey region from Table 1) with previous results from the literature. The profiles are centred in the type-cD galaxy.
5.2 Mass-to-light ratios
To compute the stellar masses and luminosities, rather than relying on magnitudes for a given aperture, we compute the stellar mass and luminosity associated with each pixel in our field of view. Obviously, the pixels containing galaxies not in the cluster have their stellar masses wrongly estimated but we can mask these regions out later on in our analysis. We compute the ‘B-Johnson’ luminosity of the cluster galaxies on a pixel-by-pixel basis using the new version of the Bayesian Photometric Redshifts (bpz; Benítez 2000) software. We assume that all galaxies (pixels) have the same redshift and assign to each pixel of the image one of the bpz templates based on their ACS colours. We then calculate the absolute magnitude in the Vega-calibrated Johnson ‘B band’, using the F814W magnitude and the inferred spectra type. The stellar masses for each pixel are also calculated from the bpz fits to each pixel, using the relationship between rest frame (g−i) colour and stellar mass of Taylor et al. (2011).
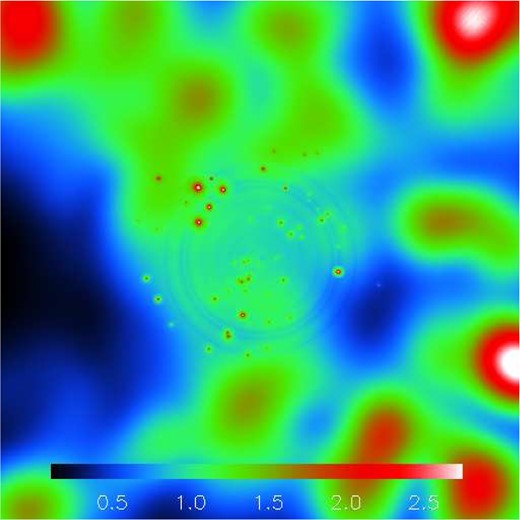
Since our mass model has the galaxy member component differentiated from the diffuse dark matter halo component, we can compute light-to-mass ratios at the position of the member galaxies. The total mass in the galaxies is computed from our reconstructed solution by multiplying the fiducial mass map by the corresponding C1 and C2 factors of the derived solution. The stellar mass can be computed in the same regions after applying a mask that is equal to the footprint of our assumed mass map for the fiducial galaxies. At the same time, we can compute ratios between the total mass derived from our lensing analysis and the stellar mass in the same field of view (without applying any mask or restricting ourselves to particular galaxies).
The mass-to-light ratio oscillates around a typical value of ∼20 for most of the galaxies, with a small decrease towards the central galaxy. In particular, we find a mass-to-light ratio of M/LB = 21 ± 14 inside the r < 1 arcmin region that drops to M/LB = 17 ± 8 inside the r < 40 arcsec region. Recently, Okabe et al. (2014) found that at large cluster radii, the mass-to-light ratio of subhaloes in the Coma cluster tend to the typical values for clusters (around 200), whereas this ratio decreases towards the centre of the cluster to values around M/LB ≈ 35 (for h = 0.7) (see also, Natarajan et al. 2009). When comparing with previous results, our mass-to-light ratios are typically smaller than the ones found in the literature (see for instance Bardeau et al. 2007; Medezinski et al. 2007 where they find typical values of about an order of magnitude larger). This is mostly due to the fact that our mass-to-light ratios are computed after averaging the masses and luminosities in the footprint defined by the member galaxies while other authors consider the entire cluster where a significant fraction of the area is not occupied by member galaxies. This is highlighted in Fig. 10 where the ratio is higher in the region between the member galaxies. Our results are more in line with those derived from isolated systems, (see for instance Jiménez-Vicente et al. 2014 for a recent result where they find significantly smaller stellar to DM mass ratios).
Ratio of total mass to stellar mass. The field of view is 3.35 arcmin and is centred in the main cD galaxy. The orientation (and scale) is similar to Fig. 1 (right-hand panel).
The fact that our critical curves present a smoother form when compared to previous estimations (see for instance Broadhurst et al. 2005b; Halkola et al. 2006; Limousin et al. 2007; Coe et al. 2010) while the total mass inside the Einstein radius is consistent with previous work, is suggesting that the masses associated with the individual galaxies in our solution are smaller than the corresponding masses derived from alternative methods. The mass-to-light ratio inferred from our solution is therefore probably smaller than the one that could be derived from those alternative methods.
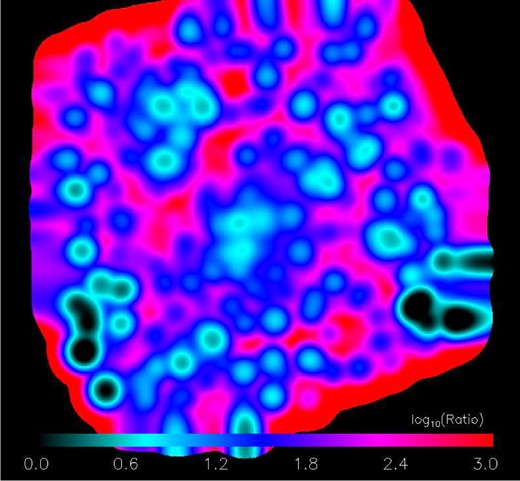
Regarding the DM to stellar mass ratios, Fig. 10 shows the ratio (in log-scale) between the derived total mass from lensing and the inferred stellar mass from the F814W band. The map of the ratio has been smoothed with a Gaussian of FWHM = 6.3 arcsec to reduce the noise fluctuations but also to reduce the impact of background sources and other galaxies not included in our fiducial mass model. The smallest ratios (dark regions) correspond to bright galaxies in the outer regions of the cluster and that were not included in our fiducial model. The highest ratios correspond to regions in the cluster with no significant emission in the F814W band but that have DM in our lens model. Note the gradient at the centre of the main cluster and subcluster in the north-east towards lower ratio values indicating that, as expected, the fraction of baryons with respect to the DM is higher in these regions.
6 COSMOLOGICAL IMPLICATIONS
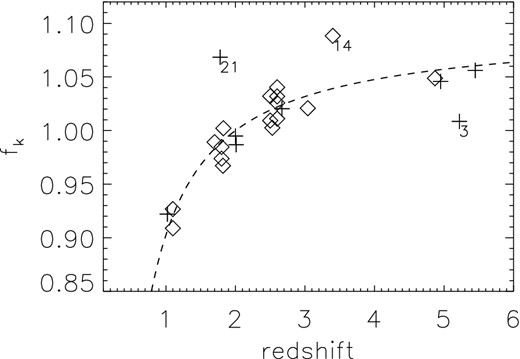
The dashed line corresponds to the function fk for a flat model (Ωm = 0.3, Λ = 0.7) compared with the data (diamonds correspond to systems with spectroscopic redshifts and crosses to systems with photometric redshifts). The main outliers are marked with their corresponding ID.
This function is normalized for convenience to z = 2 and the shape is determined by the cosmological model. Each data point correspond to a multiply lensed system (out of our set of 26). Due to the more unprecise reconstruction in the very centre of the cluster, we exclude images that are at a distance of 5 arcsec or less from the centre. Diamonds correspond to the spectroscopic redshift systems and cross symbols to those with only photometric redshifts. The dashed line indicates the expected behaviour of our data points for a standard cosmological model (flat ΛCDM model with Ωm = 0.3). In the ideal scenario where there is no projection effects and we are able to reconstruct the deflection field perfectly, the data points would lie perfectly along the curve for the correct choice of cosmological model. Some scatter is seen here about this expected relation. The symmetry of the scatter indicates that the deflection field we recover is not noise free and imperfections and projection effects along the line of sight unrelated to the cluster must at some level limit the accuracy of this comparison. However, it is important to notice that our result is obtained with just one cluster and is not optimized for in terms of the ‘best’ multiply lensed systems. For instance, three systems are marked in the above plot that depart more significantly from the expected theoretical behaviour. System number 3 corresponds to a system with only a photometric redshift (and this redshift might be wrong) and besides, two of the images of this system are relatively close to each other (this close proximity of course enhances the uncertainty in estimating fk for such systems) and the third image is basically buried behind one of the large elliptical galaxies (and hence very sensitive to the exact mass distribution of this member galaxy at a level not incorporated in our member galaxy model. A similar situation is found in system 21, where two radial images are close to the centre (although farther than the 5 arcsec exclusion radius mentioned above) and one of them is very close to one of the member elliptical galaxies. System 14 corresponds to a system that lies well beyond the Einstein radius, where our reconstruction is less well constrained. It is obvious from the above plot that a more accurate description of the lens (for instance through the addition of new spectroscopic systems, especially at high redshift) would permit a tighter constraint on the cosmological model. A study based on stacking fk for many lensing clusters should be able to provide competitive constraints on the cosmological model based on this potentially important independent test, for which some simulations have been explored (Lubini et al. 2014).
7 VARIABILITY OF THE POSSIBLE SOLUTIONS
We refer to the best-fitting model presented above as our reference solution since in the context of this form of modelling there is no single unique solution, given that the number of lensed images and the grid resolution are finite. So more important than finding a statistically best solution is to understand the range of possible solutions that are consistent with the data. Hence, as discussed in previous papers (Diego et al. 2005a, 2005b, 2007; Ponente & Diego 2011; Sendra et al. 2014), we intentionally seek an approximate solution to the system of equations. A major mistake in this form of modelling is to adopt a grid of higher resolution than justified by the number of lensed images. In this limit, we may obtain what appear to be a near-perfect solution that matches identically the locations of all lensed images but at the expense of a mass distribution that is much more highly structured on small scales that is physically reasonable, including negative surface densities. Such forced solutions tend to predict sources (in the source plane) that are unreasonably small and concentrated together in the centre of the field of view corresponding to huge lens magnifications. This overfitting regime can be avoided by appreciating that uncertainties in the data and the approximations made by our non-parametric reconstruction means that a minimal, inevitable level of error must be allowed in the reconstruction. This includes our assumptions and approximations introduced from our hypothesis that the member galaxy deflections are strictly proportional to the light, and that the soft component can be exactly modelled by a superposition of Gaussians of a given pixel scale, or that the sources in the source plane are delta functions, or that there are no significant projection effects of matter along the line of sight etc.
As our input catalogue, we consider first a reliable set of 26 robust strongly lensed systems in which we have great faith. Some of these systems have only photometric redshifts which can be imprecise. Changing the SL (or WL) data set has an impact on the reconstructed solution as the constraints in the system change accordingly. Additional sources of uncertainty in the final solution are related to the particular choice of the initial guess in the minimization process or the number of iterations of the algorithm. In this section, we explore these sources of variability.
7.1 Dependence with iteration number
The number of iterations determine some of the properties of the solution (see Sendra et al. 2014 for details). Adding the fiducial deflection field helps in solving some known issues with non-parametric methods like regularization and the overfitting problem. Nevertheless, overfitting can still occur if the number of iterations is too large so the algorithm always needs to be stopped after a given number of iterations. Using the location of the radial critical curves is a sensitive choice for identifying an optimal range for the number of iterations, as the radius of this critical curve is well defined in the data as it can be seen to be fairly circular in shape from the distribution of very radially extended images. This is not the case for the tangential critical curve.
In this paper, this part of the analysis is done a posteriori. However, it could be in principle incorporated into the system of linear equations, however, this is beyond the scope of this work and will be studied in more detail in a future paper, see however Cacciato et al. (2006) and Merten et al. (2009) where the critical curves are directly used as constraints. In Fig. 12, we show three solutions corresponding to three different numbers of iterations (where the number of parameters fitted and the initial condition in the minimization are identical between these three solutions). From left to right, we show the solutions obtained after 5000, 8000 and 15 000 iterations. By looking at the tangential curves, the three cases look different but they still accommodate well the large tangential arcs in between the tangential critical curve. The radial curve, on the other hand, when compared with the position of key well-identified radial arcs, is clearly too large in the case of 5000 iterations and too small in the case of 15 000 iterations. In contrast, in the case of 8000 iterations, the radial critical curve (computed for z = 2) overlaps almost perfectly with the mean position of different radial arcs present in the cluster at redshifts z ≈ 2. This simple comparison seems to indicate that the best solutions are obtained with our code after ∼8000 iterations. Using the radial critical curve as a way of determining the optimal range of iterations can be also seen as a regularization of our problem. This is an interesting alternative since it is solely based on actual data.
Solutions (and associated critical curves for a source at redshift z = 2) for three different iteration numbers. Left corresponds to 5000 iterations, middle to 8000 iterations and right to 15 000 iterations. Note how for 8000 iterations both radial and tangential critical curves fall very close to radial and tangential arcs.
An idea of the dependence of the solution with the number of iterations can be obtained also from Fig. 13. In the top part of this plot, we represent the total mass contained in the grid (solid line) versus the iteration number. The solid and dashed lines represent the correction factors C1 and C2, that are applied to the fiducial deflection fields from the galaxies. As the iteration number grows, there is a trade between the mass contained in the grid, and the mass in the galaxies but the total mass (especially in the central region) stays more or less constant beyond a few thousand iterations as can be seen better from the profiles (Fig. 14). A similar trend was observed when applying the method to simulated data (Sendra et al. 2014). As the iteration number grows, the solution increases its complexity in order to concentrate the arcs into smaller sources. As the fiducial field has only two degrees of freedom (C1 and C2), new features appear only in the grid part of the solution at the expense of reducing the mass in the member galaxies to keep the total mass more or less constant (within the Einstein radius). Of course, and as mentioned earlier, to avoid overfitting, the minimization process has to be stopped at some point (stopping the minimization after a number of iterations could be seen also as a regularization process). In the range of iterations (6000–10 000) where reliable solutions exist, the changes in the model are small in the central 4 arcmin region. It is also important to note that the increased rise in mass in the grid part of the solution after 2000 iterations (see Fig. 13) is driven mostly by the cells in the outermost region (beyond the Einstein radius).
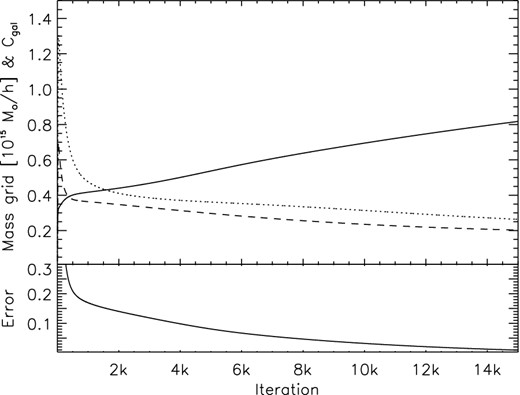
Top panel: total mass in the grid (solid line) versus iteration number (from 1 to 15 000). The dotted and dashed lines show the two coefficients C1 and C2, respectively. These coefficients multiply the fiducial fields for the type-cD (C2) galaxy and the remaining galaxies (C1). The bottom panel shows the value of the function that is being minimized as a function of iteration number (the units have been re-scaled by a constant for clarity purposes)
Convergence profiles for the three cases shown in Fig. 12. The solid line corresponds to the 5000 iteration case, the dotted line to the 8000 iteration case and dashed line to the 15000 iteration case. Again, the smaller subplot shows the tails of these distributions across the transition phase and up the 5 arcmin maximum radius.
It can also be seen (see the inset in the upper-right corner of Fig. 14) that as the iteration number grows, the grid starts to accumulate mass in the transition phase between the 6.66 arcmin region and the buffer zone. The bottom panel of Fig. 13 shows the quantity that is being minimized (properly re-scaled by some constant for clarity) as a function of the iteration number.
When looking at how the mass evolves in the different cells as a function of the iteration number, we observe that the central regions converge first and the outer regions converge last. The region around the buffer zone starts to monotonically grow in mass after a few thousand iterations. For a very large iteration number, the inner region stays stable and most of the changes in mass occur beyond the Einstein radius.
7.2 Dependence with the initial guess
When minimizing a multidimensional quadratic function, one can find infinite solutions (for a given error) by varying the starting point of the minimization, all of them equally good in the sense of fitting the data set. The regions in the lens plane that are more sensitive to the data will converge quickly towards stationary points while regions with weaker sensitivity to the data might vary more from minimization to minimization or even not vary significantly and retain values close to their initial values (memory effect).
In Fig. 15, we show the average (solid) and 1σ region (dotted) of 40 reconstructions where in each one we change the initial condition by setting it to a vector of random numbers obtained from a Gaussian distribution. The dispersion of this Gaussian distribution is a random variable itself and is such that the total mass in the initial condition takes values in the range [∼0.2, ∼2] × 1015 M⊙ h−1. Table 1 includes the values of the mean and errors as a function of distance. The solution retains some memory of the initial condition specially in the outer region where the constraints in the solution are the weakest. The most remarkable aspect of this plot is that all solutions seem to converge to the same profile in the range 20–30 arcsec defining a stability region for the solution.
Mean profile and dispersion of the 40 solutions shown in Fig. 15. Both the mean profile and dispersion are given in units of Σ/Σcrit with Σcrit computed at z = 1.07. The last column shows the integrated (cylindrical) mass in units of 1014 M⊙ h−1.
| arcsec | Mean | Disp. | M(< r) |
|---|---|---|---|
| 2.343 | 3.117 | 0.282 | 0.015 |
| 4.296 | 2.174 | 0.149 | 0.036 |
| 7.031 | 1.744 | 0.089 | 0.072 |
| 10.15 | 1.562 | 0.064 | 0.128 |
| 12.50 | 1.514 | 0.058 | 0.179 |
| 14.45 | 1.411 | 0.046 | 0.228 |
| 16.40 | 1.327 | 0.036 | 0.281 |
| 18.35 | 1.242 | 0.026 | 0.339 |
| 20.70 | 1.153 | 0.016 | 0.412 |
| 23.04 | 1.133 | 0.015 | 0.492 |
| 25.78 | 1.020 | 0.003 | 0.592 |
| 28.12 | 0.9477 | 0.006 | 0.680 |
| 30.46 | 0.9079 | 0.010 | 0.772 |
| 32.81 | 0.8616 | 0.015 | 0.869 |
| 35.15 | 0.7836 | 0.024 | 0.968 |
| 37.89 | 0.7198 | 0.032 | 1.083 |
| 40.62 | 0.6644 | 0.039 | 1.201 |
| 43.35 | 0.6308 | 0.044 | 1.320 |
| 46.09 | 0.5962 | 0.049 | 1.444 |
| 48.82 | 0.5367 | 0.057 | 1.565 |
| 51.56 | 0.4985 | 0.062 | 1.683 |
| 54.68 | 0.4976 | 0.063 | 1.819 |
| 57.81 | 0.4616 | 0.067 | 1.961 |
| 60.93 | 0.4619 | 0.067 | 2.097 |
| 64.06 | 0.3747 | 0.077 | 2.226 |
| 67.18 | 0.3324 | 0.081 | 2.341 |
| 70.70 | 0.3148 | 0.082 | 2.466 |
| 74.21 | 0.2976 | 0.081 | 2.589 |
| 77.73 | 0.2592 | 0.083 | 2.702 |
| 81.25 | 0.2402 | 0.083 | 2.808 |
| 84.76 | 0.2292 | 0.082 | 2.910 |
| 88.28 | 0.2145 | 0.080 | 3.011 |
| 92.18 | 0.2007 | 0.079 | 3.119 |
| 96.09 | 0.1900 | 0.078 | 3.225 |
| 100.0 | 0.1837 | 0.077 | 3.350 |
| 103.9 | 0.1725 | 0.076 | 3.432 |
| 107.8 | 0.1638 | 0.076 | 3.530 |
| 112.1 | 0.1554 | 0.075 | 3.634 |
| 116.4 | 0.1474 | 0.074 | 3.735 |
| 120.7 | 0.1409 | 0.074 | 3.829 |
| 125.3 | 0.1341 | 0.073 | 3.929 |
| 130.0 | 0.1285 | 0.072 | 4.040 |
| 135.1 | 0.1238 | 0.071 | 4.125 |
| 140.6 | 0.1204 | 0.070 | 4.234 |
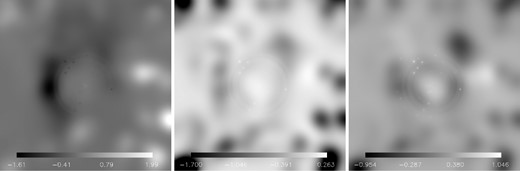
This convergence is made more evident when looking at the 2D version of the above result. In Fig. 16 , we show the average of the mass solutions (left-hand panel) from which the above profile is derived. The middle panel shows the dispersion of the mass map and the right-hand panel shows the signal-to-noise ratio (or SNR) defined as the ratio of the left-hand and middle panels. There is a remarkably well-defined circular region of high SNR around 20–30 arcsec from the centre. In this region, the solutions seem to be insensitive to the initial condition and they all render almost identical results. This region corresponds to a stability region of the solution where the profile is constrained very well. A second interesting aspect can be seen also in the SNR map. The high SNR of the DM blob (SNR ≈ 16), just south of the stability region (i.e the bright blob approximately 2.5 arcmin from the centre of the image on the right-hand panel of Fig. 16), indicates that this might be a real substructure. This feature has not been previously claimed and indeed parametric methods would not incorporate such dark substructure in principle. Other interesting features emerge from the SNR map as potential real substructures of the cluster although with a lower SNR. The dispersion map shows how there is a region (upper-right quadrant) where the solutions fluctuate the most indicating that the mass map is less reliable in this region.
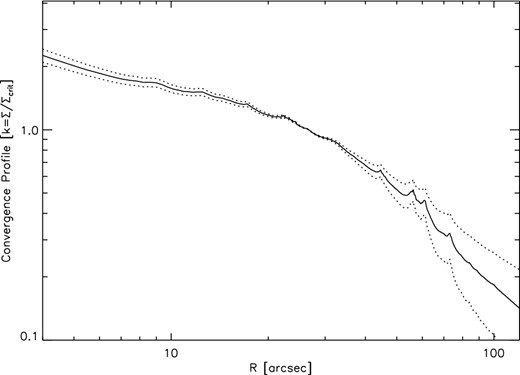
Average profile of the convergence from 40 independent solutions (solid line). The dotted lines represent the dispersion of these solutions.
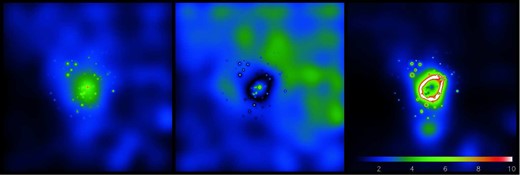
Reconstructed average mass from 40 independent solutions in the 10 arcmin field of view (left-hand panel). The middle panel shows the dispersion of these solutions. The right-hand panel shows the SNR map defined as the average map (left-hand panel) divided by the dispersion map (middle panel). The SNR vary between SNR = 0.7 at its minimum and SNR = 290 at its maximum (but saturated in this plot above SNR = 100). All maps are shown as the square root (in order to increase contrast) and the colour scale (shown in the right-hand panel) is the same in all panels.
Finally, as expected (and already shown in the profile plot), the dispersion of the solutions in the central region (that is, around the cD galaxy) is larger, indicating therefore that our solution is not very sensitive to the very central region. This is due mostly to the fact that the larger arcs have a bigger weight in our solution. In a future paper, we aim to study in more detail the most central region taking advantage of the stability region identified in this paper, and the possible implications for the mass profile of the cD galaxy.
7.3 Dependence with the number of systems and redshift
Identifying pairs of images in the SL regime is not always free of subjectivity, resting on experience. A1689 is probably the most scrutinized lens, with hundreds of arclets seen in the image, each with its own distortion that makes it difficult to find morphologically similar galaxies. The colours may also vary across the object due to differential magnification, and also because of overlap with other unrelated images or due to diffuse light in the cluster affecting the colours of relatively faint background galaxies. Spectroscopic redshifts of the arclets are often the best way to discriminate among different possibilities but even this does not always settle the differences and furthermore neighbouring galaxies may become confused in the process if they have the same redshift to within the resolution limits. A good example of this is the difficulty to distinguish between systems 10 and 12 (both having basically the same spectroscopic redshift). Different authors have assigned the arclets to different systems (see Table A1). In this section, we explore the impact on the solution when we consider different subsets of arclets in our SL part of the data set.
In Table A1, we compile all the systems that were found in the literature and we add several new systems (candidates) which are identified with our model. For the new systems, we simply assume that they are at redshift z = 2 when assessing their deflection angles. This is a useful approximation given the weak dependence of the deflection angles over the range z = [1, 3] (as shown by Fig. 11) and should be sufficient for our purposes. For our test, we compare our reference solution described in Section 5, which depended on only the 26 established systems, with new model solutions obtained for sets of images composed in the following three ways.
We consider the extended sample of systems listed in Table A1 but exclude sources 25 and 32 for which multiple options exist for the same system. That is, we consider 48 sources out of the total 50 systems listed in Table A1.
As a second subsample, we consider the subset of 18 sources from the original 26 sources of our reference solution for which spectroscopic redshifts are available, in Table A1.
The third subsample is the same as the original sample of 26 but for the sources with photometric redshifts, we allow the redshifts to vary (uniformly) by a generous 2σ error, adopting the σ values in Coe et al. (2010).
The extended data set of 48 systems is displayed in Fig. 17 where the original 26 systems are shown in black and the additional 22 systems in white. For each case, we reproduce the minimization process of Section 5 that is, we adopt the same initial condition, number of iterations and make use of both SL and WL data, in order to better examine model differences resulting from changes of the data set. Fig. 18 shows this comparison in terms of the resulting mass profiles for the above cases.
In black, the original robust data set of 26 sources. In white, we show the additional arcs that together with the previous 26 sources data set conform the extended 48 source data set of Table A1 (sources 25 and 32 are not used). The field of view is 3.33 arcmin.
Comparison of the profiles obtained with different subsets of sources. The thick solid line corresponds to our reference solution (26 sources). The dotted line corresponds to the solution obtained with the full sample of in Table A1 (we exclude sources 25 and 32), or case (i) (see text). The dashed line corresponds to the subset with spectroscopic redshifts (18 sources) or case (ii) (see text) and the dot–dashed line corresponds to the same initial set of 26 sources but the sources with photo-z taking different redshifts, or case (iii) (see text). The bottom panel shows the relative difference between the different curves (B) and the reference model (A). The solid, dotted, dashed and dot–dashed line have the same meaning as in the top panel.
Another interesting point from Fig. 18, is that the same stability region discussed in Section 7.2 seems to be present when we change the SL data set, in the range 20–30 arcsec, where the solutions seem to be insensitive to the particular choice of data sets (among the four used in this comparison). This reinforces the idea that the solution is very well constrained in this regime (20–30 arcsec) and nearly insensitive to the intrinsic variation of the solutions.
Going beyond the differences in profile, we look at the mass maps for the above cases, comparing the reference solution and the three solutions described above. The result is shown in Fig. 19. In this case, the mass difference has been divided by the profile of the reference solution to increase contrast. Also, the middle panel has been saturated below values of −1.7 (the most negative value was −5) also for contrast purposes. The difference maps show where the surface mass density modifies itself in order to accommodate the possible changes in the data set and by extension, it marks the regions where extra caution needs to be taken into account when interpreting our main results, should the assumed original data set of 26 sources be compromised by systematics.
The figures show the difference between our reference solution and solutions obtained with three alternative subsets of sources. In all cases, the difference has been divided by the profile of the reference solution in order to visually maximize the differences. Hence, a value of 2 in this graph means that in the difference of the two solutions (reference-alternative) there is two times the average mass of the profile for that radial bin etc. Some values (near the edges) have been saturated also for contrast purposes (the middle panel had a large negative deviation of −5 in the bottom-left corner that was saturated to −1.7). The field of view corresponds to 6.66 arcmin across. Left-hand panel: case for which all 48 sources in Table A1 are used (we exclude 25 and 32). Middle panel: case for which only the spectroscopic subsample of 18 sources is being used. Right-hand panel: case for which the original 26 subsample of sources is used but the sources with photometric redshift take different values, case (iii).
7.4 Dependence on the grid configuration
The choice of grid resolution is an important decision that affects the performance of the reconstruction and must be made with some care. Ideally, we would set a large number of cells that allows for a more detailed reconstruction. In practice however, a very large number of cells results only in a more noisy reconstruction that needs to be smoothed (regularized). The smoothed image captures the main eigenmodes of the solution that would be reconstructed also with a smaller number of cells. Also, a large number of cells implies a larger system of equations to resolve and a slower convergence. This limits the ability to explore the space of possible solutions, which is important. On the other hand, a very small number of cells results in a more compact system of linear equations that can be resolved fast but at the expense of not capturing some of the potentially smaller scale details of the mass distribution and consequently forcing the entire mass distribution to adopt, often erroneous, distributions in order to fit the observations. As shown by Ponente & Diego (2011) and Sendra et al. (2014), a low-resolution grid can still produce reliable solutions but only after allowing for a larger error in the reconstruction. Fig. 20 shows the reconstructed solution when a lower resolution grid is used. In this case, all the cell sizes are the same and equal to 25 × 25 arcsec2. The solution obtained with this regular grid resembles a smoothed version of the reference solution except in the radial critical curve where the lack of resolution does not allow for a detailed reconstruction. In this case, the values of C1 and C2 are 0.26 and 0.23, respectively.
Mass and critical curve for a low-resolution grid reconstruction (SL+WL). The cell sizes are 2.7 times larger in this case than in the reference solution.
A compromise alternative would be to use a multiresolution grid where regions with a complex mass distribution are sampled with smaller cells and regions with a more smooth mass distribution (or less sensitive to the data) are sampled with larger cells. This possibility was explored in previous papers and produces satisfactory results although it is not entirely free of problems. In particular, the boundary region between regions of differing resolution tends to produce biased results (when tested with simulated data). The size of the cell normally introduces a prior in the solution. The reconstruction tends to put more mass in the smallest cells. This problem can be mitigated by solving in an iterative way where the first iteration assumes a regular grid (no prior) and the consecutive iterations increase the resolution in regions where the previous iteration found more mass. We have tried a battery of configurations and found that some of them (in particular those with multiresolution) produce significant artefacts in the solution that need to be avoided. Regular grids are always more stable and reliable so in our particular case and due to the large field of view involved (10 × 10 arcmin2) we choose a grid with good resolution in the central field of view (6 × 6 arcmin2) and a lower resolution grid in the outer region (buffer zone). As expected, the solution near the boundary between the two regions produce artefacts as discussed above. We have checked that variations in the grid sizes of ∼30 per cent with respect to our configuration, finding the results are nearly identical to the those presented in this paper. The cell sizes in the central part of the field of view are larger than the halo sizes of the galaxies (except the central galaxy) facilitating the orthogonality of the grid+galaxy base.
7.5 Dependence with the parameters in the fiducial model
In order to test the sensitivity of the solution to the assumptions made for the adopted profile for the member galaxy component, we compare the reference solution (solid line in Fig. 21) with two different assumptions regarding galaxy profiles. In the first case (dotted line in Fig. 21), we vary both the total mass of each galaxy and the scale radius by a factor ∼2 (above and below the values in the reference solution) so the ratio between the new masses or scale radii with respect to the ones in the reference model is around 2. In the second case (dotted line in Fig. 21), we take the extreme (and unrealistic) case where all the masses in the galaxies are considered to be in just the centre of each galaxy (that is, galaxies are considered delta functions) and we also change their masses by a factor ∼2 with respect to the reference solution case. Remarkably, there is a region of stability (around 20–40 arcsec) where the profile seems to be unaffected by the particular choice of the fiducial deflection field, even in the case where we consider unphysical assumptions for the fiducial field (delta function case for the galaxy masses). The dotted line (different NFW profiles for each galaxy) is almost indistinguishable from the reference solution. The dashed line case (delta functions) shows a relative deficit in mass at very short radii, since all the mass of the central galaxy is concentrated at (r = 0) which is not shown in the plot. At larger radii (r = 50–100 arcsec), the grid part of the solution shows an excess of mass (with respect to the reference solution). This might be due to a compensation effect of the unphysical nature of the delta function assumption although this is not observed at r = 20–30 arcsec. When finding solutions, we are of course dealing with the deflection field and since this relates to the gradient of the potential we may not be so surprised about the independence of the resulting model mass distribution with the choice of galaxy profile, since the galaxy potential is always extended even in the case of point masses.
Changes in the reconstructed profile under three assumptions for the member galaxies in the cluster. The solid line corresponds to the reference solution discussed above, the dotted line is for a different model where both the scale radius and total mass of the assumed NFW profile for the individual galaxies is changed by a factor ∼2. The dashed line corresponds to another different realization of the masses in the galaxies (different also by a factor ∼2 with respect to the reference model) but their profiles are taken to the extreme case of delta functions. For the dashed line, there is a peak at the centre not shown in this plot that corresponds to the central galaxy.
8 PREDICTED NEW SYSTEMS/ARCS
Using our solution (masses and source positions) for the case of SL+WL and 8000 iterations in Section 5, we can predict the position of the multiple images for each source. In most cases, the agreement between these positions and the observed arcs is very good with typical errors of less than 5 arcmin in the image plane but there are some deviations between the model and the data set that are interesting to explore in more detail. Disagreements between the predicted arcs and input data might reveal a systematic bias in the solution in that particular region of the image plane or even some tension between the identification of the multiple images in the data set. Also, new images (from a given system) might be identified with the new model. Fig. 22 shows two interesting cases. In dark grey, we show the distance to the source position when that particular point in the image plane is projected back into the source plane at the redshift of the source (its inverse can be seen as the probability of having a counterimage). White crosses mark the observed position of the arcs in the original data set while black crosses show the predicted position of the delensed observed positions. These systems together with the remaining systems in Table A1 can be found online at this website.6 The reader should keep in mind that the predictions are based on the reference model that is obtained only from 26 systems, so systems 32 and beyond in Table A1 are not used to constrain this model. The predictions for these systems are useful to check how consistent the second half of Table A1 (systems 32 and above) is with the first half.
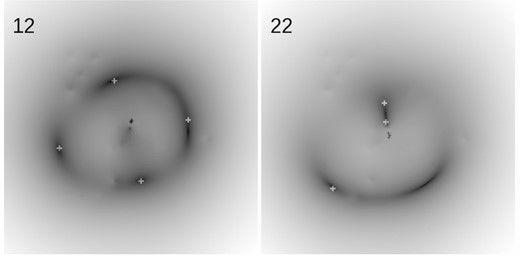
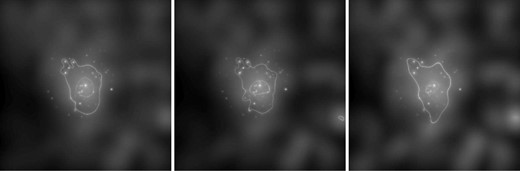
Predicted positions for systems 12 (left) and 22 (right). The observed positions are shown as white crosses and the prediction positions in dark grey. The smaller black crosses correspond to the deprojected observed positions. For system 12, the solution correctly predicts an arclet (on the right-hand side) identified by Limousin et al. (2007). For system 22, no counterimage is found at or near the position predicted by the solution (bottom right).
We show the interesting cases for systems 12 and 22. In system 12, we observe that the model predicts a new image on the right-hand side of the field of view. Exploring this position in the original ACS image, the alleged new image is easily identified about 10 arcsec north of the predicted position. Given the fact that this is near a critical curve, 10 arcsec are actually a relatively short distance along a critical curve. That new image was already correctly identified by Limousin et al. (2007). On the other hand, system 22 shows a clear prediction that is missing from our data set (and others in the literature).
ACS data shows nothing that resembles this bright and distinctive source indicating that this is either a region that is near the regime where multiple sources merge and disappear (as suggested by the fact that by moving the source position a few arcseconds the predicted image disappears) or, maybe more likely, that the mass model is not very well constrained in this part of the lens plane.
From our reference model, we have also identified a set of 11 new system candidates never published before. These new system candidates are listed in Table A1 (in the appendix) with IDs ranging from 51 to 61. For most of these systems, we have assumed a redshift of z = 2. The stamps for the arclets in the new system candidates are shown in Figs A1 and A2 (also in the appendix). The full collection of stamps for the arclets in Table A1 can be found online at this website.7
9 CONCLUSIONS
We present a robust estimation of the DM distribution in the cluster A1689. We explore the range of variability of the solutions and identify a region of minimum variance where the solution is stable against changes in the configuration of the data set, the number of iterations, the grid resolution and, assumptions made on the fiducial deflection field. We also identify regions where the results should be taken with more caution. Our solution can be used to identify additional strongly lensed systems. We identify 11 new systems (candidates) and confirm some of the previous identifications like including the contentious system number 12 where our solution correctly predicts the fourth arclet identified in Limousin et al. (2007).
Even though the WL measurements have a typical sampling scale of 1 arcmin, through the combination of the SL and WL data sets in the same minimization algorithm, we manage to improve upon this resolution beyond the Einstein radius and be sensitive to smaller scales (than the ones available to WL analysis). This allows us to resolve details unseen before in the DM distribution around and beyond the Einstein radius, some of which have no obvious correlation with the luminous matter. At larger radii (r > 2 arcmin), the sensitivity to smaller details weakens as the SL data set loses its capability to constrain the matter distribution at these distances.
A consequence of knowing the mass distribution of a lens is that it makes it possible to make predictions that can be used in other observations. For instance, we can derive redshifts for sources with unknown redshift by projecting the system back at different redshifts and finding the redshift at which the system come into focus. Fig. 23 is an example for two of the photometric redshift systems in our sample. For these sources, the lens predicts lower redshifts than the photo-z although the predicted redshift is still consistent with the photo-z.
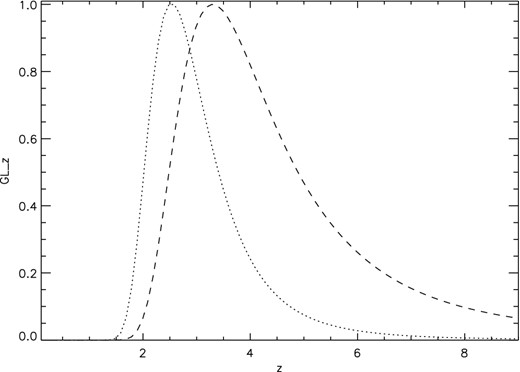
Gravitational lensing redshift prediction for systems 8 (dotted) and 9 (dashed) from our reference model.
The mass model can be also used to impose constraints on the cosmological model, for instance through the fk function as shown in Section 6 although we also show that in order to get competitive constraints, one should probably rely on stacking results from multiple clusters.
Finally, our free-form model allows us to determine the mass-to-light ratio of the main galaxies in the cluster. We find ratios that are generally consistent with earlier results found in the literature. However, with the exception of the central galaxy, the galaxies in our model assume the same M/LB ratio limiting somehow the power of our study. A more detailed study where member galaxies are allowed to take on individual M/LB ratios will be considered in a future work.
The authors would like to thank the referee, Eric Jullo, for very useful comments and suggestions that have helped improved this paper substantially. JMD acknowledges support of the consolider project CAD2010-00064 and AYA2012-39475-C02-01 funded by the Ministerio de Economia y Competitividad. JMD also acknowledges the hospitality of the Department of Physics and Astronomy at UPenn during part of this research. KU acknowledges partial support from the National Science Council of Taiwan (grant NSC100-2112-M-001-008-MY3). MS acknowledges financial support from the agreement ASI/INAF/023/12/0. NB and TB acknowledge support of the grants AYA2010- 22111-C03-01 funded by the Ministerio de Economía y Competitividad and PEX/10-CFQM-6444 of the Junta de Andalucía.
multidrizzle is a software tool developed by the Science Software Branch at the STSCI and it is appositely designed for to the combination of dithered images and rejection of cosmic rays.
This step was performed by using the iraf-geomap package.
A full set of stamps from this table can be found at http://max.ifca.unican.es/diego/FigsA1689/
REFERENCES
APPENDIX A: COMPILATION OF ARC POSITIONS AND STAMPS
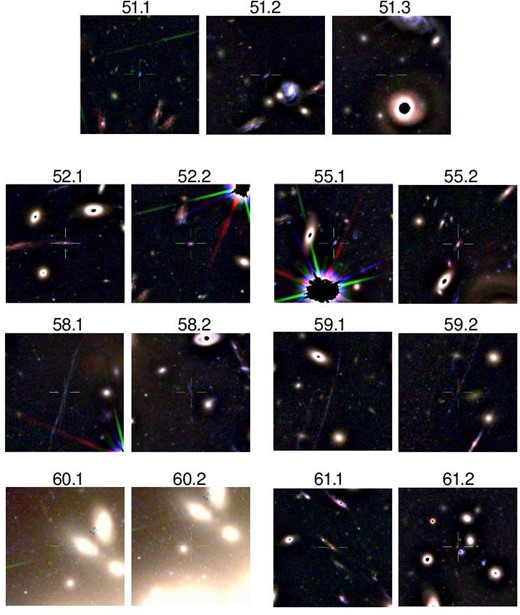
Images have been filtered to reduce light glare from member galaxies except for system 60 which is shown in its original unfiltered version.
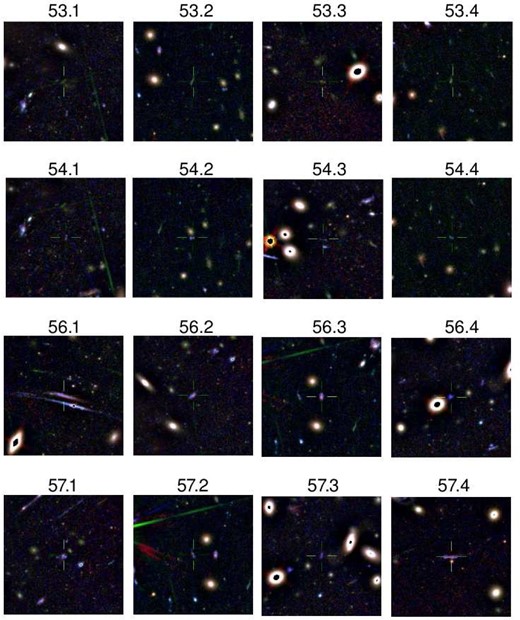
Light from member galaxies has been reduced through a high-pass filter.
SL data set. The second column shows the new system ID following the original notation of Broadhurst et al. (2005b). The third column shows the original notation (Broadhurst et al. 2005b). Systems not present in the original paper are left blank in this column. The fourth column indicates previous papers in the literature where that system was identified, B05 is for Broadhurst et al. (2005b), L07 for Limousin et al. (2007), C10 for Coe et al. (2010) and D14 for this paper. Fifth and sixths columns show the coordinates of each arclet. Discrepancies with some of the positions published in Coe et al. (2010) are corrected in the present version of the table. Column 7 includes the redshifts used in our study and are taken from Coe et al. (2010). A negative sign in this column indicates that they are photo-z. New systems in this work are all assumed to have z = 2. Column number 8 shows the Δβ derived from our reference model (in arcseconds), see equation (5). The last column shows the distance between the observed and predicted positions, Δθ, derived from our reference model (in arcseconds). Cut-outs from these images together with additional information like the magnitudes of the new systems can be found on this website http://max.ifca.unican.es/diego/FigsA1689/. Also on the same website, there is a file with useful comments from the referee based on a comparison between our solution and the model of Limousin et al. (2007).
| i | ID | B05 | REF | RAJ2000(h:m:s) | DECJ2000(d:m:s) | z | Δβ(arcsec) | Δθ(arcsec) |
|---|---|---|---|---|---|---|---|---|
| 1 | 1.1 | 1.1 | B05 | 13:11:26.257 | −1:19:58.753 | 3.04 | 1.03 | 1.95 |
| 2 | 1.2 | 1.2 | B05 | 13:11:26.088 | −1:20:02.261 | 3.04 | 0.73 | 1.10 |
| 3 | 1.3 | 1.3 | B05 | 13:11:29.584 | −1:21:09.475 | 3.04 | 2.50 | 2.10 |
| 4 | 1.4 | 1.4 | B05 | 13:11:32.870 | −1:20:29.403 | 3.04 | 1.27 | 2.27 |
| 5 | 1.5 | 1.5 | B05 | 13:11:31.742 | −1:20:07.998 | 3.04 | 3.98 | 1.23 |
| 6 | 1.6 | 1.6 | B05 | 13:11:29.661 | −1:20:40.413 | 3.04 | 2.44 | 3.60 |
| 7 | 2.1 | 2.1 | B05 | 13:11:26.331 | −1:19:57.450 | 2.53 | 0.92 | 1.74 |
| 8 | 2.2 | 2.2 | B05 | 13:11:32.771 | −1:20:27.494 | 2.53 | 1.78 | 3.14 |
| 9 | 2.3 | 2.3 | B05 | 13:11:31.780 | −1:20:09.147 | 2.53 | 3.42 | 1.17 |
| 10 | 2.4 | 2.4 | B05 | 13:11:29.619 | −1:21:08.008 | 2.53 | 2.32 | 1.23 |
| 11 | 2.5 | 2.5 | B05 | 13:11:29.686 | −1:20:41.365 | 2.53 | 2.02 | 0.87 |
| 12 | 3.1 | 3.1 | B05 | 13:11:31.850 | −1:20:29.520 | −5.47 | 2.30 | 1.61 |
| 13 | 3.2 | 3.2 | B05 | 13:11:31.979 | −1:20:35.287 | −5.47 | 1.29 | 5.97 |
| 14 | 3.3 | 3.3 | B05 | 13:11:31.492 | −1:20:58.040 | −5.47 | 3.33 | 2.50 |
| 15 | 4.1 | 4.1 | B05 | 13:11:31.978 | −1:20:59.355 | 1.10 | 0.18 | 2.10 |
| 16 | 4.2 | 4.2 | B05 | 13:11:30.326 | −1:21:14.026 | 1.10 | 2.24 | 1.59 |
| 17 | 4.3 | 4.3 | B05 | 13:11:30.565 | −1:20:10.322 | 1.10 | 3.02 | 2.10 |
| 18 | 4.4 | 4.4 | B05 | 13:11:26.094 | −1:20:37.422 | 1.10 | 0.94 | 3.22 |
| 19 | 4.5 | 4.5 | B05 | 13:11:29.653 | −1:20:31.357 | 1.10 | 2.23 | 2.10 |
| 20 | 5.1 | 5.1 | B05 | 13:11:28.873 | −1:20:50.776 | 2.60 | 2.10 | 1.61 |
| 21 | 5.2 | 5.2 | B05 | 13:11:29.032 | −1:20:46.153 | 2.60 | 3.10 | 4.15 |
| 22 | 5.3 | 5.3 | B05 | 13:11:33.927 | −1:20:22.919 | 2.60 | 5.20 | 3.05 |
| 23 | 6.1 | 6.1 | B05 | 13:11:30.555 | −1:19:39.995 | 1.10 | 1.57 | 12.2 |
| 24 | 6.2 | 6.2 | B05 | 13:11:33.154 | −1:20:14.174 | 1.10 | 2.70 | 0.50 |
| 25 | 6.3 | 6.3 | B05 | 13:11:32.558 | −1:19:56.506 | 1.10 | 1.45 | 4.07 |
| 26 | 6.4 | 6.4 | B05 | 13:11:32.289 | −1:20:00.857 | 1.10 | 2.72 | 1.46 |
| 27 | 7.1 | 7.1 | B05 | 13:11:25.256 | −1:20:53.843 | 4.87 | 7.68 | 4.20 |
| 28 | 7.2 | 7.2 | B05 | 13:11:30.478 | −1:20:15.902 | 4.87 | 3.18 | 4.45 |
| 29 | 7.3 | 7.3 | B05 | 13:11:29.627 | −1:20:26.870 | 4.87 | 9.33 | 3.92 |
| 30 | 8.1 | 8.1 | B05 | 13:11:32.105 | −1:20:52.909 | −2.67 | 1.32 | 6.50 |
| 31 | 8.2 | 8.2 | B05 | 13:11:31.210 | −1:21:07.541 | −2.67 | 3.41 | 12.0 |
| 32 | 8.3 | 8.3 | B05 | 13:11:31.313 | −1:20:16.078 | −2.67 | 2.57 | 2.10 |
| 33 | 8.4 | 8.4 | B05 | 13:11:25.337 | −1:20:22.162 | −2.67 | 2.87 | 4.70 |
| 34 | 8.5 | 8.5 | B05 | 13:11:30.136 | −1:20:32.494 | −2.67 | 6.61 | 2.76 |
| 35 | 9.1 | 9.1 | B05 | 13:11:30.115 | −1:19:50.652 | −5.16 | 7.14 | 1.23 |
| 36 | 9.2 | 9.2 | B05 | 13:11:33.328 | −1:20:52.335 | −5.16 | 1.31 | 0.87 |
| 37 | 9.3 | 9.3 | B05 | 13:11:28.554 | −1:21:17.805 | −5.16 | 2.08 | 1.23 |
| 38 | 9.4 | 9.4 | B05 | 13:11:26.079 | −1:20:28.927 | −5.16 | 4.37 | 11.7 |
| 39 | 10.1 | 10.1 | B05 | 13:11:33.786 | −1:20:52.855 | 1.83 | 1.78 | 1.23 |
| 40 | 10.2 | 10.2 | B05 | 13:11:27.857 | −1:20:14.477 | 1.83 | 3.89 | 1.99 |
| 41 | 10.3 | 10.3 | B05 | 13:11:29.125 | −1:20:29.744 | 1.83 | 2.67 | 1.61 |
| 42a | 10.4 | 12.2 | B05 | 13:11:27.166 | −1:20:56.946 | 1.83 | 3.72 | 2.27 |
| 43b | 10.5 | 12.3 | B05 | 13:11:27.033 | −1:20:53.910 | 1.83 | 4.57 | 3.33 |
| 44 | 11.1 | 11.1 | B05 | 13:11:33.149 | −1:21:08.754 | 2.50 | 2.35 | 1.10 |
| 45 | 11.2 | 11.2 | B05 | 13:11:28.866 | −1:20:03.292 | 2.50 | 1.54 | 4.20 |
| 46 | 11.3 | 11.3 | B05 | 13:11:29.300 | −1:20:28.381 | 2.50 | 2.05 | 0.39 |
| 47c | 12.1 | 12.1 | B05 | 13:11:30.171 | −1:19:53.471 | 1.83 | 6.34 | 2.37 |
| 48d | 12.2 | 12.4 | B05 | 13:11:28.771 | −1:21:12.265 | 1.83 | 2.66 | 0.78 |
| 49e | 12.3 | 31.2 | L07 | 13:11:33.081 | −1:20:46.390 | 1.83 | 1.31 | 1.25 |
| 50a | 12.4 | 31.4 | L07 | 13:11:26.303 | −1:20:24.080 | 1.83 | 2.64 | 8.98 |
| 51 | 13.1 | 13.1 | B05 | 13:11:32.631 | −1:19:26.371 | −1.02 | 1.05 | 9.70 |
| 52 | 13.2 | 13.2 | B05 | 13:11:32.795 | −1:19:27.831 | −1.02 | 0.97 | 6.91 |
| 53 | 13.3 | 13.3 | B05 | 13:11:33.200 | −1:19:33.134 | −1.02 | 2.03 | 1.23 |
| 54 | 14.1 | 14.1 | B05 | 13:11:28.835 | −1:21:43.802 | 3.40 | 0.65 | 6.68 |
| 55 | 14.2 | 14.2 | B05 | 13:11:29.266 | −1:21:44.623 | 3.40 | 0.65 | 0.50 |
| 56 | 15.1 | 15.1 | B05 | 13:11:27.882 | −1:20:17.196 | 1.80 | 0.50 | 2.50 |
| 57 | 15.2 | 15.2 | B05 | 13:11:33.883 | −1:20:53.311 | 1.80 | 1.03 | 0.39 |
| 58 | 15.3 | 15.3 | B05 | 13:11:29.046 | −1:20:29.573 | 1.80 | 0.96 | 0.39 |
| 59 | 16.1 | 16.1 | B05 | 13:11:27.790 | −1:20:27.319 | −2.01 | 1.63 | 2.37 |
| 60 | 16.2 | 16.2 | B05 | 13:11:28.721 | −1:20:30.546 | −2.01 | 3.14 | 3.14 |
| 61 | 16.3 | 16.3 | B05 | 13:11:34.205 | −1:20:48.402 | −2.01 | 1.55 | 0.87 |
| 62 | 17.1 | 17.1 | B05 | 13:11:30.463 | −1:20:26.890 | 2.60 | 3.04 | 2.76 |
| 63 | 17.2 | 17.2 | B05 | 13:11:30.196 | −1:20:29.765 | 2.60 | 6.11 | 2.10 |
| 64 | 17.3 | 17.3 | B05 | 13:11:24.787 | −1:20:43.865 | 2.60 | 9.12 | 4.36 |
| 65 | 18.1 | 18.1 | B05 | 13:11:28.052 | −1:20:11.540 | 1.80 | 1.23 | 2.20 |
| 66 | 18.2 | 18.2 | B05 | 13:11:33.627 | −1:20:56.539 | 1.80 | 0.86 | 0.87 |
| 67 | 18.3 | 18.3 | B05 | 13:11:29.169 | −1:20:29.392 | 1.80 | 0.43 | 0.87 |
| 68 | 19.1 | 19.1 | B05 | 13:11:31.440 | −1:20:24.597 | 2.60 | 3.53 | 3.14 |
| 69 | 19.2 | 19.2 | B05 | 13:11:25.047 | −1:20:22.003 | 2.60 | 5.47 | 4.70 |
| 70 | 19.3 | 19.3 | B05 | 13:11:31.762 | −1:21:01.315 | 2.60 | 3.61 | 5.48 |
| 71 | 19.4 | 19.4 | B05 | 13:11:31.859 | −1:20:59.131 | 2.60 | 2.02 | 3.49 |
| 72 | 19.5 | 19.5 | B05 | 13:11:30.017 | −1:20:35.961 | 2.60 | 3.05 | 1.95 |
| 73 | 21.1 | 21.1 | B05 | 13:11:30.833 | −1:20:47.776 | −1.78 | 1.45 | 4.71 |
| 74 | 21.2 | 21.2 | B05 | 13:11:30.608 | −1:20:46.743 | −1.78 | 2.42 | 1.40 |
| 75 | 21.3 | 21.3 | B05 | 13:11:25.061 | −1:20:13.207 | −1.78 | 3.51 | 1.61 |
| 76 | 22.1 | 22.1 | B05 | 13:11:29.493 | −1:20:10.794 | 1.70 | 3.73 | 7.85 |
| 77 | 22.2 | 22.2 | B05 | 13:11:29.423 | −1:20:25.762 | 1.70 | 1.71 | 0.39 |
| 78 | 22.3 | 22.3 | B05 | 13:11:32.222 | −1:21:17.917 | 1.70 | 4.69 | 2.81 |
| 79 | 23.1 | 23.1 | B05 | 13:11:29.337 | −1:20:12.016 | −2.00 | 2.94 | 9.37 |
| 80 | 23.2 | 23.2 | B05 | 13:11:29.361 | −1:20:24.891 | −2.00 | 1.06 | 0.55 |
| 81 | 23.3 | 23.3 | B05 | 13:11:32.465 | −1:21:17.199 | −2.00 | 3.45 | 1.95 |
| 82 | 24.1 | 24.1 | B05 | 13:11:28.998 | −1:20:58.177 | 2.60 | 0.06 | 2.47 |
| 83 | 24.2 | 24.2 | B05 | 13:11:31.871 | −1:19:52.560 | 2.60 | 0.95 | 2.27 |
| 84 | 24.3 | 24.3 | B05 | 13:11:30.101 | −1:19:36.140 | 2.60 | 3.12 | 1.65 |
| 85 | 24.4 | 24.4 | B05 | 13:11:33.525 | −1:20:21.863 | 2.60 | 3.32 | 1.40 |
| 86 | 24.5 | 24.5 | B05 | 13:11:29.436 | −1:20:38.999 | 2.60 | 7.13 | 7.04 |
| 87b | 25.1 | 25.1 | B05 | 13:11:28.302 | −1:20:36.990 | 2.50 | 9.30 | 0.78 |
| 88c | 25.2a | 25.2 | B05 | 13:11:34.455 | −1:20:35.581 | 2.50 | 6.71 | 6.92 |
| 89d | 25.2b | D14 | 13:11:33.970 | −1:20:41.300 | 2.50 | 22.47 | 5.14 | |
| 90e | 25.2c | 45.2 | C10 | 13:11:35.489 | −1:20:32.950 | 2.50 | 37.17 | 13.1 |
| 91 | 28.1 | 28.1 | B05 | 13:11:28.105 | −1:20:12.907 | −5.45 | 0.83 | 3.05 |
| 92 | 28.2 | 28.2 | B05 | 13:11:34.067 | −1:21:02.009 | −5.45 | 2.62 | 1.56 |
| 93f | 28.3 | 28.3 | C10 | 13:11:29.100 | −1:20:28.610 | −5.45 | 2.11 | 0.55 |
| 94 | 29.1 | 29.1 | B05 | 13:11:29.033 | −1:20:59.909 | 2.50 | 1.04 | 0.55 |
| 95 | 29.2 | 29.2 | B05 | 13:11:29.845 | −1:19:36.215 | 2.50 | 3.95 | 9.95 |
| 96 | 29.3 | 29.3 | B05 | 13:11:31.952 | −1:19:54.565 | 2.50 | 1.44 | 2.76 |
| 97 | 29.4 | 29.4 | B05 | 13:11:33.433 | −1:20:22.815 | 2.50 | 3.72 | 1.95 |
| 98 | 29.5 | 29.5 | B05 | 13:11:29.537 | −1:20:38.603 | 2.50 | 9.75 | 4.89 |
| 99 | 30.1 | 30.1 | B05 | 13:11:32.228 | −1:19:21.826 | 3.00 | 1.95 | 9.08 |
| 100 | 30.2 | 30.2 | B05 | 13:11:32.990 | −1:19:28.069 | 3.00 | 0.49 | 5.52 |
| 101 | 30.3 | 30.3 | B05 | 13:11:33.461 | −1:19:34.691 | 3.00 | 2.44 | 4.15 |
| 102 | 32.1 | L07 | 13:11:31.998 | −1:20:05.530 | 3.00 | 3.69 | 0.39 | |
| 103 | 32.2 | L07 | 13:11:33.023 | −1:20:22.900 | 3.00 | 1.10 | 1.23 | |
| 104 | 32.3 | L07 | 13:11:29.396 | −1:21:04.830 | 3.00 | 0.12 | 1.23 | |
| 105 | 32.4 | L07 | 13:11:29.611 | −1:20:45.350 | 3.00 | 3.53 | 1.99 | |
| 106l | 32.5a | L07 | 13:11:26.407 | −1:19:59.600 | 3.00 | 8.00 | 14.08 | |
| 107m | 32.5b | D14 | 13:11:27.470 | −1:19:41.520 | 3.00 | 6.86 | 9.21 | |
| 108 | 33.1 | L07 | 13:11:28.256 | −1:21:02.660 | 4.58 | 7.29 | 7.37 | |
| 109n | 33.2 | L07 | 13:11:34.460 | −1:20:35.600 | 4.58 | 7.29 | 3.22 | |
| 110 | 35.1 | L07 | 13:11:28.367 | −1:21:01.350 | 1.90 | 2.45 | 2.81 | |
| 111 | 35.2 | L07 | 13:11:33.765 | −1:20:34.520 | 1.90 | 4.12 | 1.56 | |
| 112 | 35.3 | L07 | 13:11:29.238 | −1:20:36.660 | 1.90 | 5.60 | 3.14 | |
| 113 | 36.1 | L07 | 13:11:31.373 | −1:19:47.940 | 3.00 | 0.26 | 1.65 | |
| 114 | 36.2 | L07 | 13:11:31.493 | −1:19:49.390 | 3.00 | 0.26 | 0.55 | |
| 115 | 40.1 | L07 | 13:11:30.067 | −1:20:14.040 | 2.52 | 4.98 | 9.25 | |
| 116 | 40.2 | L07 | 13:11:25.983 | −1:21:05.290 | 2.52 | 4.98 | 3.12 | |
| 117 | 41.1 | C10 | 13:11:27.679 | −1:20:50.710 | −2.50 | 12.23 | 7.51 | |
| 118 | 41.2 | C10 | 13:11:35.329 | −1:20:31.380 | −2.50 | 29.37 | 12.57 | |
| 119 | 41.3 | C10 | 13:11:28.769 | −1:20:36.120 | −2.50 | 17.19 | 14.08 | |
| 120 | 42.1 | C10 | 13:11:28.479 | −1:19:44.980 | −2.00 | 4.31 | 11.72 | |
| 121 | 42.2 | C10 | 13:11:31.077 | −1:19:55.520 | −2.00 | 5.44 | 7.75 | |
| 122 | 42.3 | C10 | 13:11:33.317 | −1:20:37.890 | −2.00 | 1.60 | 0.55 | |
| 123 | 42.4 | C10 | 13:11:28.842 | −1:21:09.490 | −2.00 | 1.22 | 2.10 | |
| 124 | 44.1 | C10 | 13:11:28.324 | −1:20:23.380 | −2.00 | 11.81 | 2.62 | |
| 125 | 44.2 | C10 | 13:11:34.338 | −1:21:04.010 | −2.00 | 11.81 | 4.55 | |
| 126 | 46.1 | C10 | 13:11:31.476 | −1:20:49.190 | −2.50 | 4.65 | 10.00 | |
| 127 | 46.2 | C10 | 13:11:24.766 | −1:20:15.980 | −2.50 | 4.65 | 3.68 | |
| 128 | 48.1 | C10 | 13:11:31.365 | −1:20:38.470 | −2.00 | 2.29 | 7.12 | |
| 129 | 48.2 | C10 | 13:11:24.911 | −1:20:19.820 | −2.00 | 2.29 | 2.50 | |
| 130 | 49.1 | C10 | 13:11:28.660 | −1:20:15.470 | −2.00 | 2.76 | 5.85 | |
| 131 | 49.2 | C10 | 13:11:33.376 | −1:21:08.730 | −2.00 | 2.76 | 2.27 | |
| 132 | 50.1 | C10 | 13:11:32.387 | −1:20:45.600 | −2.50 | 2.16 | 5.80 | |
| 133 | 50.2 | C10 | 13:11:30.828 | −1:21:11.080 | −2.50 | 2.13 | 5.42 | |
| 134 | 50.3 | C10 | 13:11:31.467 | −1:20:15.660 | −2.50 | 0.05 | 1.65 | |
| 135 | 51.1 | D14 | 13:11:33.650 | −1:20:17.710 | −2.00 | 3.05 | 2.20 | |
| 136 | 51.2 | D14 | 13:11:30.470 | −1:19:34.740 | −2.00 | 2.09 | 3.35 | |
| 137 | 51.3 | D14 | 13:11:32.050 | −1:19:45.140 | −2.00 | 1.51 | 1.74 | |
| 138 | 52.1 | D14 | 13:11:29.480 | −1:19:35.920 | −1.80 | 1.10 | 0.87 | |
| 139 | 52.2 | D14 | 13:11:33.090 | −1:20:17.170 | −1.80 | 1.10 | 0.87 | |
| 140 | 53.1 | D14 | 13:11:31.500 | −1:20:06.590 | −3.00 | 1.72 | 2.97 | |
| 141 | 53.2 | D14 | 13:11:32.920 | −1:20:36.490 | −3.00 | 5.26 | 9.44 | |
| 142 | 53.3 | D14 | 13:11:30.120 | −1:21:21.210 | −3.00 | 12.79 | 5.44 | |
| 143 | 53.4 | D14 | 13:11:25.910 | −1:20:08.430 | −3.00 | 6.02 | 11.82 | |
| 144 | 54.1 | D14 | 13:11:31.480 | −1:20:09.980 | −2.00 | 1.75 | 0.78 | |
| 145 | 54.2 | D14 | 13:11:32.690 | −1:20:37.270 | −2.00 | 1.34 | 1.61 | |
| 146 | 54.3 | D14 | 13:11:29.900 | −1:21:12.120 | −2.00 | 2.66 | 4.20 | |
| 147 | 54.4 | D14 | 13:11:25.770 | −1:20:11.550 | −2.00 | 4.04 | 5.80 | |
| 148 | 55.1 | D14 | 13:11:30.920 | −1:20:18.690 | −1.50 | 2.04 | 1.99 | |
| 149 | 55.2 | D14 | 13:11:25.480 | −1:20:31.180 | −1.50 | 2.04 | 3.35 | |
| 150 | 56.1 | D14 | 13:11:28.558 | −1:19:43.790 | −2.00 | 5.36 | 12.35 | |
| 151 | 56.2 | D14 | 13:11:31.366 | −1:19:59.450 | −2.00 | 5.03 | 3.33 | |
| 152 | 56.3 | D14 | 13:11:33.165 | −1:20:33.110 | −2.00 | 1.69 | 1.10 | |
| 153 | 56.4 | D14 | 13:11:29.049 | −1:21:06.660 | −2.00 | 2.17 | 1.40 | |
| 154 | 57.1 | D14 | 13:11:31.206 | −1:19:54.500 | −2.00 | 3.72 | 6.65 | |
| 155 | 57.2 | D14 | 13:11:33.326 | −1:20:33.100 | −2.00 | 2.55 | 1.56 | |
| 156 | 57.3 | D14 | 13:11:28.823 | −1:21:05.100 | −2.00 | 2.52 | 0.50 | |
| 157 | 57.4 | D14 | 13:11:29.953 | −1:19:43.780 | −2.00 | 1.72 | 1.95 | |
| 158 | 58.1 | H06 | 13:11:33.165 | −1:20:03.730 | −2.00 | 6.87 | 11.65 | |
| 159 | 58.2 | D14 | 13:11:29.351 | −1:20:51.190 | −2.00 | 6.87 | 1.40 | |
| 160 | 59.1 | D14 | 13:11:26.920 | −1:20:39.240 | −2.00 | 1.19 | 6.92 | |
| 161 | 59.2 | D14 | 13:11:27.136 | −1:20:48.140 | −2.00 | 1.19 | 2.27 | |
| 162 | 60.1 | D14 | 13:11:29.988 | −1:20:19.280 | −2.00 | 0.51 | 1.74 | |
| 163 | 60.2 | D14 | 13:11:29.893 | −1:20:23.050 | −2.00 | 0.51 | 2.50 | |
| 164 | 61.1 | D14 | 13:11:32.277 | −1:21:22.900 | −2.00 | 7.83 | 4.89 | |
| 165 | 61.2 | D14 | 13:11:29.524 | −1:20:10.240 | −2.00 | 7.83 | 11.87 |
aSystem has been re-organized. System 12 in L07.
bSystem has been re-organized. System 12 in L07.
cSystem 31 in L07.
dSystem 31 in L07.
eSystem has been re-organized. New arclet candidate.
fNew arclet candidate not used in our primary analysis.
gOriginal arclet not used in our analysis.
hOriginal arclet not used in our analysis. Multiple possibilities for this arclet..
iNew arclet not used in our analysis. Multiple possibilities for this arclet. 33.2 in L07. Discard (Wrong colour, too bright)..
jNew arclet not used in our primary analysis. Multiple possibilities for this arclet..
kNew arclet not used in our primary analysis.
lMultiple possibilities for this arclet.
mMultiple possibilities for this arclet.
n25.2 in B05.
