


Abstract
In this paper, we address the question of why cluster radio relics that are connected to shock acceleration, so-called radio gischt relics, have preferentially been found in the outskirts of galaxy clusters. By identifying merger shock waves in cosmological grid simulations, we explore several prescriptions for relating the energy dissipated in shocks to the energy emitted in the radio band. None of the investigated models produces detectable radio relics within 100–200 kpc from the cluster centre. All models cause >50 per cent of the detectable relic emission at projected distances >800 kpc. Central radio relics caused by shocks that propagate along the line of sight are rare events for simple geometrical reasons, and they have a low surface brightness making them elusive for current instruments. Our simulations show that the radial distribution of observed relics can be explained by the radial trend of dissipated kinetic energy in shocks, which increases with distance from the cluster centre up until half of the virial radius.
1 INTRODUCTION
Radio relics can be divided into two main groups (Kempner et al. 2004): radio gischt relics are large, elongated, often Mpc-sized, radio sources located in the periphery of merging galaxy clusters. In a few cases, their spatial colocation with shocks in the thermal gas has been determined (e.g. in the case of Abell 3667; Finoguenov et al. 2010). They most likely trace shock fronts in which particles are accelerated via diffusive shock acceleration (e.g. Blandford & Eichler 1987). Among them are double relics with the two relics located on different sides of a cluster centre (e.g. Röttgering et al. 1997; Bagchi et al. 2006, 2011; Venturi et al. 2007; Bonafede et al. 2009; van Weeren et al. 2009; Brown, Duesterhoeft & Rudnick 2011). Radio phoenices are related to radio-loud active galactic nuclei (AGNs). Fossil radio plasma from a previous episode of AGN activity is thought to be compressed by a merger shock wave which boosts both the magnetic field inside the plasma and the momenta of the relativistic particles. Here we are only concerned with radio relics of gischt type.
The sizes of relics and their separations from the cluster centre vary significantly. Examples for radio relics with sizes of 1 Mpc or even larger have been observed in Coma (Giovannini, Feretti & Stanghellini 1991), Abell 2255 (Feretti et al. 1997) and Abell 2256 (see van Weeren et al. 2011, for other examples and references).
Even though the sample of known radio relics is still small and incomplete (34; see Table 1), one can start to find correlations between the size, location and spectral index of these unique sources, which can be compared to simulations of relic formation. van Weeren et al. (2009) find that on average the smaller relics have steeper spectra. Such a trend is in line with predictions from shock statistics derived from cosmological simulations (Pfrommer et al. 2007; Hoeft et al. 2008; Skillman et al. 2008; Vazza et al. 2010). They find that larger shock waves occur mainly in lower density regions and have larger Mach numbers and consequently flatter spectra. Conversely, smaller shock waves are more likely to be found in cluster centres and have lower Mach numbers and steeper spectra. In this paper, we explore why radio gischt relics are never observed close to the centre of galaxy clusters, using a set of high-resolution cosmological re-simulations of massive galaxy clusters at three cosmic epochs (z= 0.0, 0.3 and 0.6).
2 SIMULATIONS OF RADIO EMISSION FROM SHOCKS
The simulations analysed in this work were produced with the adaptive mesh refinement code enzo v1.5, developed by the Laboratory for Computational Astrophysics at the University of California in San Diego.1 A detailed discussion on the numerical setup adopted to produce the simulations of this work is presented in Vazza et al. (2010). 20 galaxy clusters with masses in the range 6 × 10¹⁴≤M/M⊙≤ 3 × 10¹⁵ were extracted from a total cosmic volume of Lbox≈ 480 Mpc h−1. With the use of a nested grid approach to produce initial conditions at high resolution in the region of cluster formation, the final mass resolution for the dark matter (DM) component is mdm= 6.76 × 10⁸ M⊙. The refinement criterion is based on gas/DM overdensity as well as 1D velocity jumps which results in a peak resolution of 25 kpc h−1 inside a radius of ≈5–6Rv (Rv being the virial radius) from the centre of each cluster (see Vazza et al. 2010 for further details).
The assumed cosmology is the ‘concordance’Λ cold dark matter one, with Ω0= 1.0, ΩB= 0.0441, ΩDM= 0.2139, ΩΛ= 0.742, Hubble’s parameter h= 0.72 and a normalization for the primordial density power spectrum σ8= 0.8. Our simulations neglect radiative cooling, star formation and AGN feedback processes. In this work, we analyse clusters at redshifts z= 0.0, 0.3 and 0.6 [see Vazza et al. (2010, 2011a), for complementary studies of our clusters at these epochs].
2.1 Shock detection
2.2 Radio emission from shocks
For each cluster, we generated mock radio observations along each of the three coordinate axes by creating maps of FKE, weighted by a function, fM. This function encapsulates the poorly constrained dependence between the Mach number of the shock and the resulting radio emission. For instance, the acceleration efficiency of cosmic ray protons at shocks, the electron-to-proton energy ratio and the amplification of the magnetic field due to cosmic ray instabilities are still largely unknown (see e.g. Brüggen et al. 2011 for a recent review). Here we explore six different forms of fM.
Model Kin uses fM= 1 and illustrates the simple trend of the kinetic power at shocks in the simulated volume (in this case, the acceleration efficiency of particles is independent of M).
In model KJ, we use the Mach number dependent efficiency of acceleration of Kang & Jones (2007), fM=η(M), following the results of 1D studies of diffusive shock acceleration (Kang & Jones 2007).2
In the second set of models, we include the radial decrease of the cluster magnetic field and the amplification of the pre-shock magnetic field by shocks. The radial model of reference for the ‘background’ cluster magnetic field is the one inferred by Bonafede et al. (2010) for observations of the Coma cluster: B(ρ) =B0(ρ/ρ2500)α, with α≈ 0.5 and ρ2500 the density of the cluster core.
In model KJ_BtangledRadial, we include a factor, R=Bd/Bu=M2/(M2+ 3), for the amplification of an isotropic upstream magnetic field following the compression by the shock.
In all cases, the final weighting function for the kinetic energy flux is  , where BIC≈ 3.2 × (1 +z)2 μ G is the magnetic field equivalent to the inverse Compton losses from cosmic microwave background photons, at each redshift). In model KJ_BtangledRadial, we adopted the central value of B0= 5 μ G as in Bonafede et al. (2010), while in model KJ_BparallelRadial, we used B0= 1, 5 and 10 μ G. We assume here equal average values of the magnetic field for relaxed and very perturbed objects, which is supported by recent observations (Bonafede et al. 2011). The formulae for fM bracket reasonable physical models, but they cannot provide exact absolute values of the radio power in the relics. In Section 2.3, all radio maps are normalized to the maximum within the image.
In each shocked cell of our 3D grid, we compute the energy that is thus converted to radio emission using the locally computed values of M, ρ and vs. This emission is then projected along each of the three coordinate axes, for a total of 60 mock radio images for each assumed model and at each redshift. Generating projections along arbitrary angles of view (e.g. Hoeft et al. 2008) is computationally non-trivial because the computational boxes contain a large number of cells (>5003), and hence we defer it to future work. The pixels in our images have the same size (comoving 25 kpc h−1) of the maximum available 3D resolution, corresponding to the size of the primary beam of the Very Large Array in D configuration (45 × 45 arcsec2) for a luminosity distance of ≈220 Mpc (z≈ 0.05).
In Fig. 1, we show mock radio emission maps for one simulated cluster at z= 0, for three investigated emission models. This cluster experienced a major merger ∼0.5 Gyr ago, and two powerful merger shocks are expanding out of the main cluster core. These shocks are ∼1 Mpc large and morphologically similar to real observed relics and they are clearly visible in all investigated emission models. The much softer envelope of internal merger shocks and of some large-scale expanding outer ones is very difficult to detect with current radio telescopes, given that their power is several orders of magnitude dimmer than the brightest double relics, for all investigated models (see Section 3).
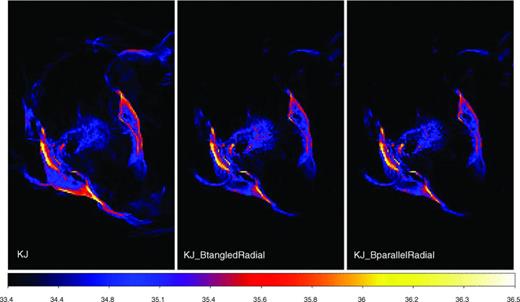
Emitted ‘radio’ power, P, from simulated relics (in colours, in units of log10P/erg s−1), for the same galaxy cluster at z= 0 and for three emission models (KJ, KJ_BparallelRadial and KJ_BtangledRadial; in the last two models, we assumed B0= 5 μ G). The side of each image is 10 Mpc h−1.
2.3 Relic detection
The mock radio observations at all redshifts were analysed with a 2D relic detection scheme, which identifies as part of the same relic all pixels brighter than a given threshold. Here we do not aim to reproduce the spectral and absolute power properties of relics, but only focus on their geometrical properties in projection. We thus normalize the pixel values of each map to the maximum within the image, and we run our relic finder over the 10 per cent most luminous pixels in each map. In most cases, the brightest pixels are connected to form relatively large (>200 comoving kpc) objects. However, depending on the threshold, some of them can be disconnected by a few cells from the main structure. We found that by considering all pixels detached by less than 8 pixels in each direction as part of the same structure, we obtain a reasonable identification of what radio observers would typically consider a relic (tests with smaller linking lengths between pixels 2 and 4 have yielded nearly identical results). Once we have identified all radio relics in each image and for every emission model, we determine their total power, size and distance from the centre of the host cluster (computed as the projected distance from the radio luminosity weighted centre of each relic and the X-ray peak).
In Fig. 2, we show the contours of the six most powerful relics detected in our sample of 60 maps at z= 0 for model KJ_BparallelRadial with B0= 5 μ G, as detected by our algorithm. The first three panels (labelled as E1-x, E1-y and E1-z) show the emission from the same object as in Fig. 1, seen along the three coordinate axes. In the other panels, the emission comes from different simulated galaxy clusters. In all panels, we also overplotted the X-ray brightness map for each cluster in colours.
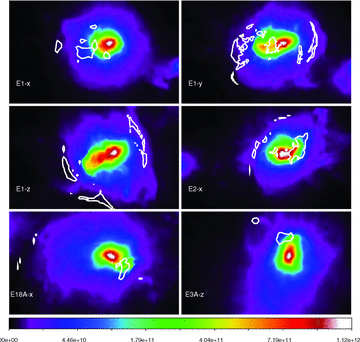
Sample of the six brightest ‘relics’ in our sample (model KJ_BparallelRadial assumed, with B0= 5 μ G). The colours represent the projected X-ray bolometric emission (in arbitrary counts) and the contours represent the objects identified with our relic finder. The size of each image is 3.5 × 2.2 Mpc h−1.
3 RESULTS
The main result of this paper is presented in Fig. 3. Here we show the cumulative distributions of projected comoving distances from the centre for the relics from our sample (Table 1) as well as the radio relics detected in our mock images for six different emission models at the three epochs. Since we do not intend to reproduce the absolute power of relics (and their chance of detection in mock images), we normalize all distributions to the observed one at a comoving radius of 2 Mpc.
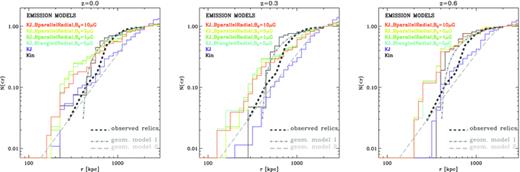
Cumulative distributions of simulated radio gischt emissions for the different emission models at z= 0, 0.3 and 0.6. The dashed dark grey line is for observed radio relics; the light grey lines are for geometrical models 1 and 2, outlined in the text (see Section 3 for details).
List of radio gischt relics. From left to right: name of the host cluster, redshift and projected distance from the centre. In the case of multiple relics per cluster, the letters N, S, E and W denote the direction with respect to the cluster centre. We note that in the case of a few objects (labelled with ‘*’ in the table) the identification as ‘radio gischt relics’ can be debated.
| Name | z | r (kpc) |
| Coma cluster | 0.023 | 2008 |
| Abell 548b | 0.042 | 693 |
| Abell 548b* | 0.042 | 456 |
| Abell 3376 E | 0.0456 | 845 |
| Abell 3376 W | 0.0456 | 1008 |
| Abell 3667 E | 0.055 | 1459 |
| Abell 3667 W | 0.055 | 1887 |
| Abell 2256 | 0.059 | 470 |
| CIZA J0649.3+1801 | 0.064 | 802 |
| RXC J1053.7+5452 | 0.07 | 981 |
| Abell 2061 | 0.078 | 1558 |
| Abell 2255 | 0.0806 | 1065 |
| Abell 3365 E | 0.093 | 1079 |
| Abell 3365 W | 0.093 | 777 |
| ZwCl 0008.8+5215 E | 0.104 | 798 |
| ZwCl 0008.8+5215 W | 0.104 | 808 |
| Abell 1664* | 0.128 | 895 |
| Abell 1240 S | 0.159 | 982 |
| Abell 1240 N | 0.159 | 924 |
| Abell 2345 E | 0.177 | 1431 |
| Abell 2345 W | 0.177 | 857 |
| Abell 1612 | 0.179 | 894 |
| CIZA J2242.8+5301 N | 0.192 | 1565 |
| CIZA J2242.8+5301 S | 0.192 | 1062 |
| Abell 115 | 0.197 | 998 |
| Abell 2163 | 0.203 | 1405 |
| Abell 746 | 0.232 | 1606 |
| RXC J1314.4−2515 W | 0.244 | 577 |
| RXC J1314.4−2515 E | 0.244 | 937 |
| Abell 521 | 0.247 | 692 |
| ZwCl 2341.1+0000 N* | 0.27 | 1198 |
| ZwCl 2341.1+0000 S | 0.27 | 767 |
| Abell 2744 | 0.308 | 1501 |
| MACS J0717.5+3745* | 0.555 | 298 |
In the observed distribution, ∼50 per cent of relics are located at distances >800 kpc from the cluster centre. In only one object of the sample (∼3 per cent), the projected radial distance is below 300 kpc (MACS J0717.5+37453). At all epochs, our simulated distributions show a very similar trend, with the exception of model KJ, in which the distributions are more extended (∼50 per cent of the relics are found at r > 1000 kpc). Notably, including a profile for the magnetic field distribution shifts the distribution to slightly lower radii compared to the other models. The resulting distribution matches the observed distribution in the range r∼ 500–2000 kpc quite well. Comparing the simulated with observed distributions at larger redshifts is more difficult, since only a few observations are available beyond z∼ 0.3. However, Fig. 3 shows that the radial distribution of simulated relics at higher redshifts is more radially concentrated compared to z= 0, due to the fact that clusters are physically smaller, and that major mergers are more frequent at large redshifts. In all cases, even at higher redshifts, the frequency of central radio relics is very low, ≤5 per cent for r≤ 300 kpc for all investigated models.
The observed distribution of relics for r > 800 kpc at z= 0 is best reproduced by models that include the spatial variation of the background cluster magnetic fields, and the local amplification by shocks. Interestingly, though, the cumulative distribution is already apparent in a model where fM= 1. This implies that the radial distribution of radio gischt relics is driven by the radial distribution of FKE. Hence, we have plotted radial profiles of FKE, volume-averaged within radial shells, for all simulated clusters at z= 0 (top panel of Fig. 4). FKE initially increases with radius, because the surface of the relics, ΔS, increases roughly as ∼r2, and  also increases with radius because of the radial drop of the ICM temperature outwards. Eventually though, the decrease in ρu (as ∼r−2 for a β model outside the cluster core, β= 2/3) wins over the increase in ΔS, and the profile of FKE will turn over. The maximum of the distribution, however, depends on the assumed fM. For a fixed acceleration efficiency, the peak is at ∼400–500 kpc, and increases to up to ∼1 Mpc if the dependence of the acceleration efficiency on Mach number, η(M), is included. In all models, we expect the number of radio relics to go down again with clustercentric distance beyond a radius of ∼0.5–1 Mpc. Since our sample has a mass range of ∼0.6 dex, we also computed the profiles normalized to the respective virial radii of the cluster (bottom panel of Fig. 4), and found a very similar behaviour, with maxima at ∼0.2–0.5Rv.
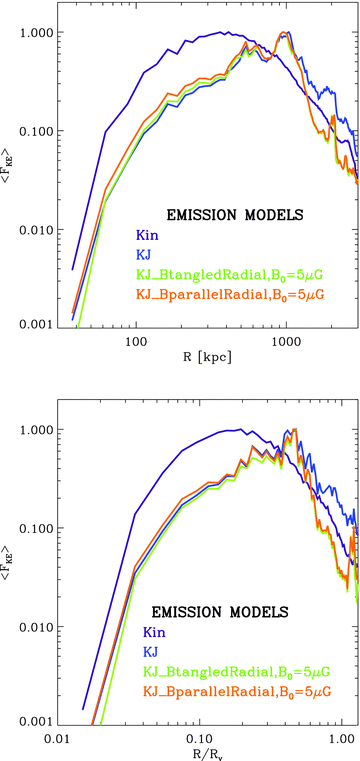
Volume-averaged (spherically and over all clusters at z= 0) profiles of the kinetic power at shocks, FKE, for the emission models investigated (for clarity, only model KJ_BparallelRadial with B0= 5 μ G is shown). Top panel: profiles averaged at physical radii. Bottom panel: same profiles as in the top panel, only as a function of radius normalized to the virial radius, Rv, of each cluster.
To test the role played by geometrical effects, we overplot in the same figure the result of a very simple 2D geometrical model (‘geometrical model 1’), which assumes that all radio relics form in a major merger with the initial size of the core, rcore (we fix rcore≈ 350 as an average value for our clusters). The radio relics increase their linear size while expanding the outer cluster atmosphere, as lrelic(r) ≈r−rcore. The relics are assumed to be visible only if the plane of the merger is in the plane of the sky, and are assumed to be invisible elsewhere due to the lack of limb brightening. In this case, the cumulative probability of finding a radio relic at a given distance from the main cluster centre is given by the ratio between the size of the relic at a given radius and the circumference of the corresponding radial shell, N(> r) =l(r)/r= (r−rcore)/r. We find that this geometric model gives a reasonable description of the observed relic distribution for r > 800 kpc (thus suggesting that the effect of limb brightening is very important for the outermost relics), but that it offers only a poor description of the observed relic distribution at smaller radii.
One may wonder why one never observes as relics the shocks in the mid-plane that form when clusters collide before core passage. These shocks turn out to have very low Mach numbers because a filament connects the two clusters. The diffuse gas in these filaments is already >106 K and this gas gets adiabatically compressed and hence heated as the two clusters approach each other. Hence, we do not find these shocks as radio relics in our cosmological simulation.
The resulting distribution of relics is shown in Fig. 3; the dimming of projected relics due to the lack of limb brightening will further decrease the chance of observing them at small distances.
From the comparison with our simulated relics, it can be seen that the effect of dimming further kills the probability of detecting relics in projections on the cluster core, even in those few cases expected by geometry. Indeed, even in the case of the most powerful relic (Fig. 1), merely a bright spot of emission is detected at ∼100 kpc from the centre in the y-projection, but most of the extension of the two giant relics is lost because of the lack of limb brightening in this case. The flux goes down by the ratio between the largest linear size of relics and their widths, which is typically >10 (see e.g. Hoeft et al. 2008; Burns & Skillman 2011).
Based on our maps, it is likely that relics in projection against the centre of the cluster have not been detected so far because of sensitivity limits of radio observations. When a shock is seen face-on, and the resulting relic is projected against the cluster centre, the peak of its radio emission lies at the edge of the cluster; it is the radio brightness that would be ∼100 times lower in projection on to the cluster centre. Relics have a low surface brightness (≈1 μJy arcsec−2 at 1.4 GHz) and, apart from a few cases, are detected at a few σ by current radio telescopes. Hence, detecting central relics as those seen in our runs would require a sensitivity currently unachievable, also for future radio telescopes (such as LOFAR and SKA) because of confusion limits.
4 CONCLUSIONS
In this paper, we explored the question of why gischt radio relics are never detected in the innermost regions of clusters. Using simple prescriptions to model the synchrotron emission emitted at shock waves, we produced mock radio maps of a sample of 20 massive galaxy clusters simulated at high resolution using the enzo code, at redshifts z= 0.0, 0.3 and 0.6. Our models parametrized the efficiency with which electrons are accelerated at shocks, the background magnetic field and the amplification of the upstream magnetic field. In all models, no detectable radio emission from radio relics is found inside the innermost ∼100–200 kpc of our clusters. Nearly ∼50 per cent of detectable radio relics are located at projected distances > 800 kpc (>0.2–0.5Rv) from the cluster centres. The low probability of observing radio relics close to cluster centres results from the fact that the kinetic energy dissipated in merger shock waves increases with distance from the cluster centre, combined with the more obvious geometrical reasons. This is because the Mach number of merger shocks as well as their surface areas increases with distance from the centre faster than the density decreases. The acceleration efficiency as a function of Mach number as well as the radial dependence of the cluster magnetic field does not alter this trend qualitatively. Finally, the lack of limb brightening makes the detection of the few central projected relics almost impossible at the typical sensitivity of all existing radio telescopes.
In summary, the lack of central radio relics in observations is due to the low energy dissipation of shock waves in cluster centres. Attempts to constrain the mechanism at work in the production of radio relics have been already explored in cosmological simulations (e.g. Miniati et al. 2001; Pfrommer et al. 2007; Hoeft et al. 2008; Skillman et al. 2011). In future, we also plan to study in more detail the statistical, spectral and morphological properties of simulated radio relics in our sample.
FV, MB, AB and KD acknowledge support through grant FOR1254 from the Deutsche Forschungsgemeinschaft (DFG). FV acknowledges computational resources under the CINECA-INAF 2008–2010 agreement. KD acknowledges the support by the DFG Cluster of Excellence ‘Origin and Structure of the Universe’. GB acknowledges the support by PRIN-INAF 2009 and ASI-INAF I/009/10/0. We acknowledge G. Giovannini for fruitful scientific discussions and C. Gheller for his fundamental contribution in producing the sample of simulated clusters. Finally, we thank the anonymous referee for useful comments.
The details of particle acceleration in the regime of Mach numbers typical of the intracluster medium (ICM), 2 ≤M≤ 5, are not yet well constrained. For instance, recent studies with particle-in-cells methods investigated additional acceleration mechanisms for particles at shocks (e.g. shock drift acceleration), suggesting the possibilities also of a different trend with Mach number and large efficiency for low Mach number shocks (Gargaté & Spitkovsky 2011).
As noted in Table 1, the identification as ‘radio gischt relics’ is also debatable, and the location of the X-ray centre of the host cluster is uncertain (see Bonafede et al. 2009; van Weeren et al. 2009).
REFERENCES
